Insight Visualizations
Visual representations of your story's structural and emotional patterns.
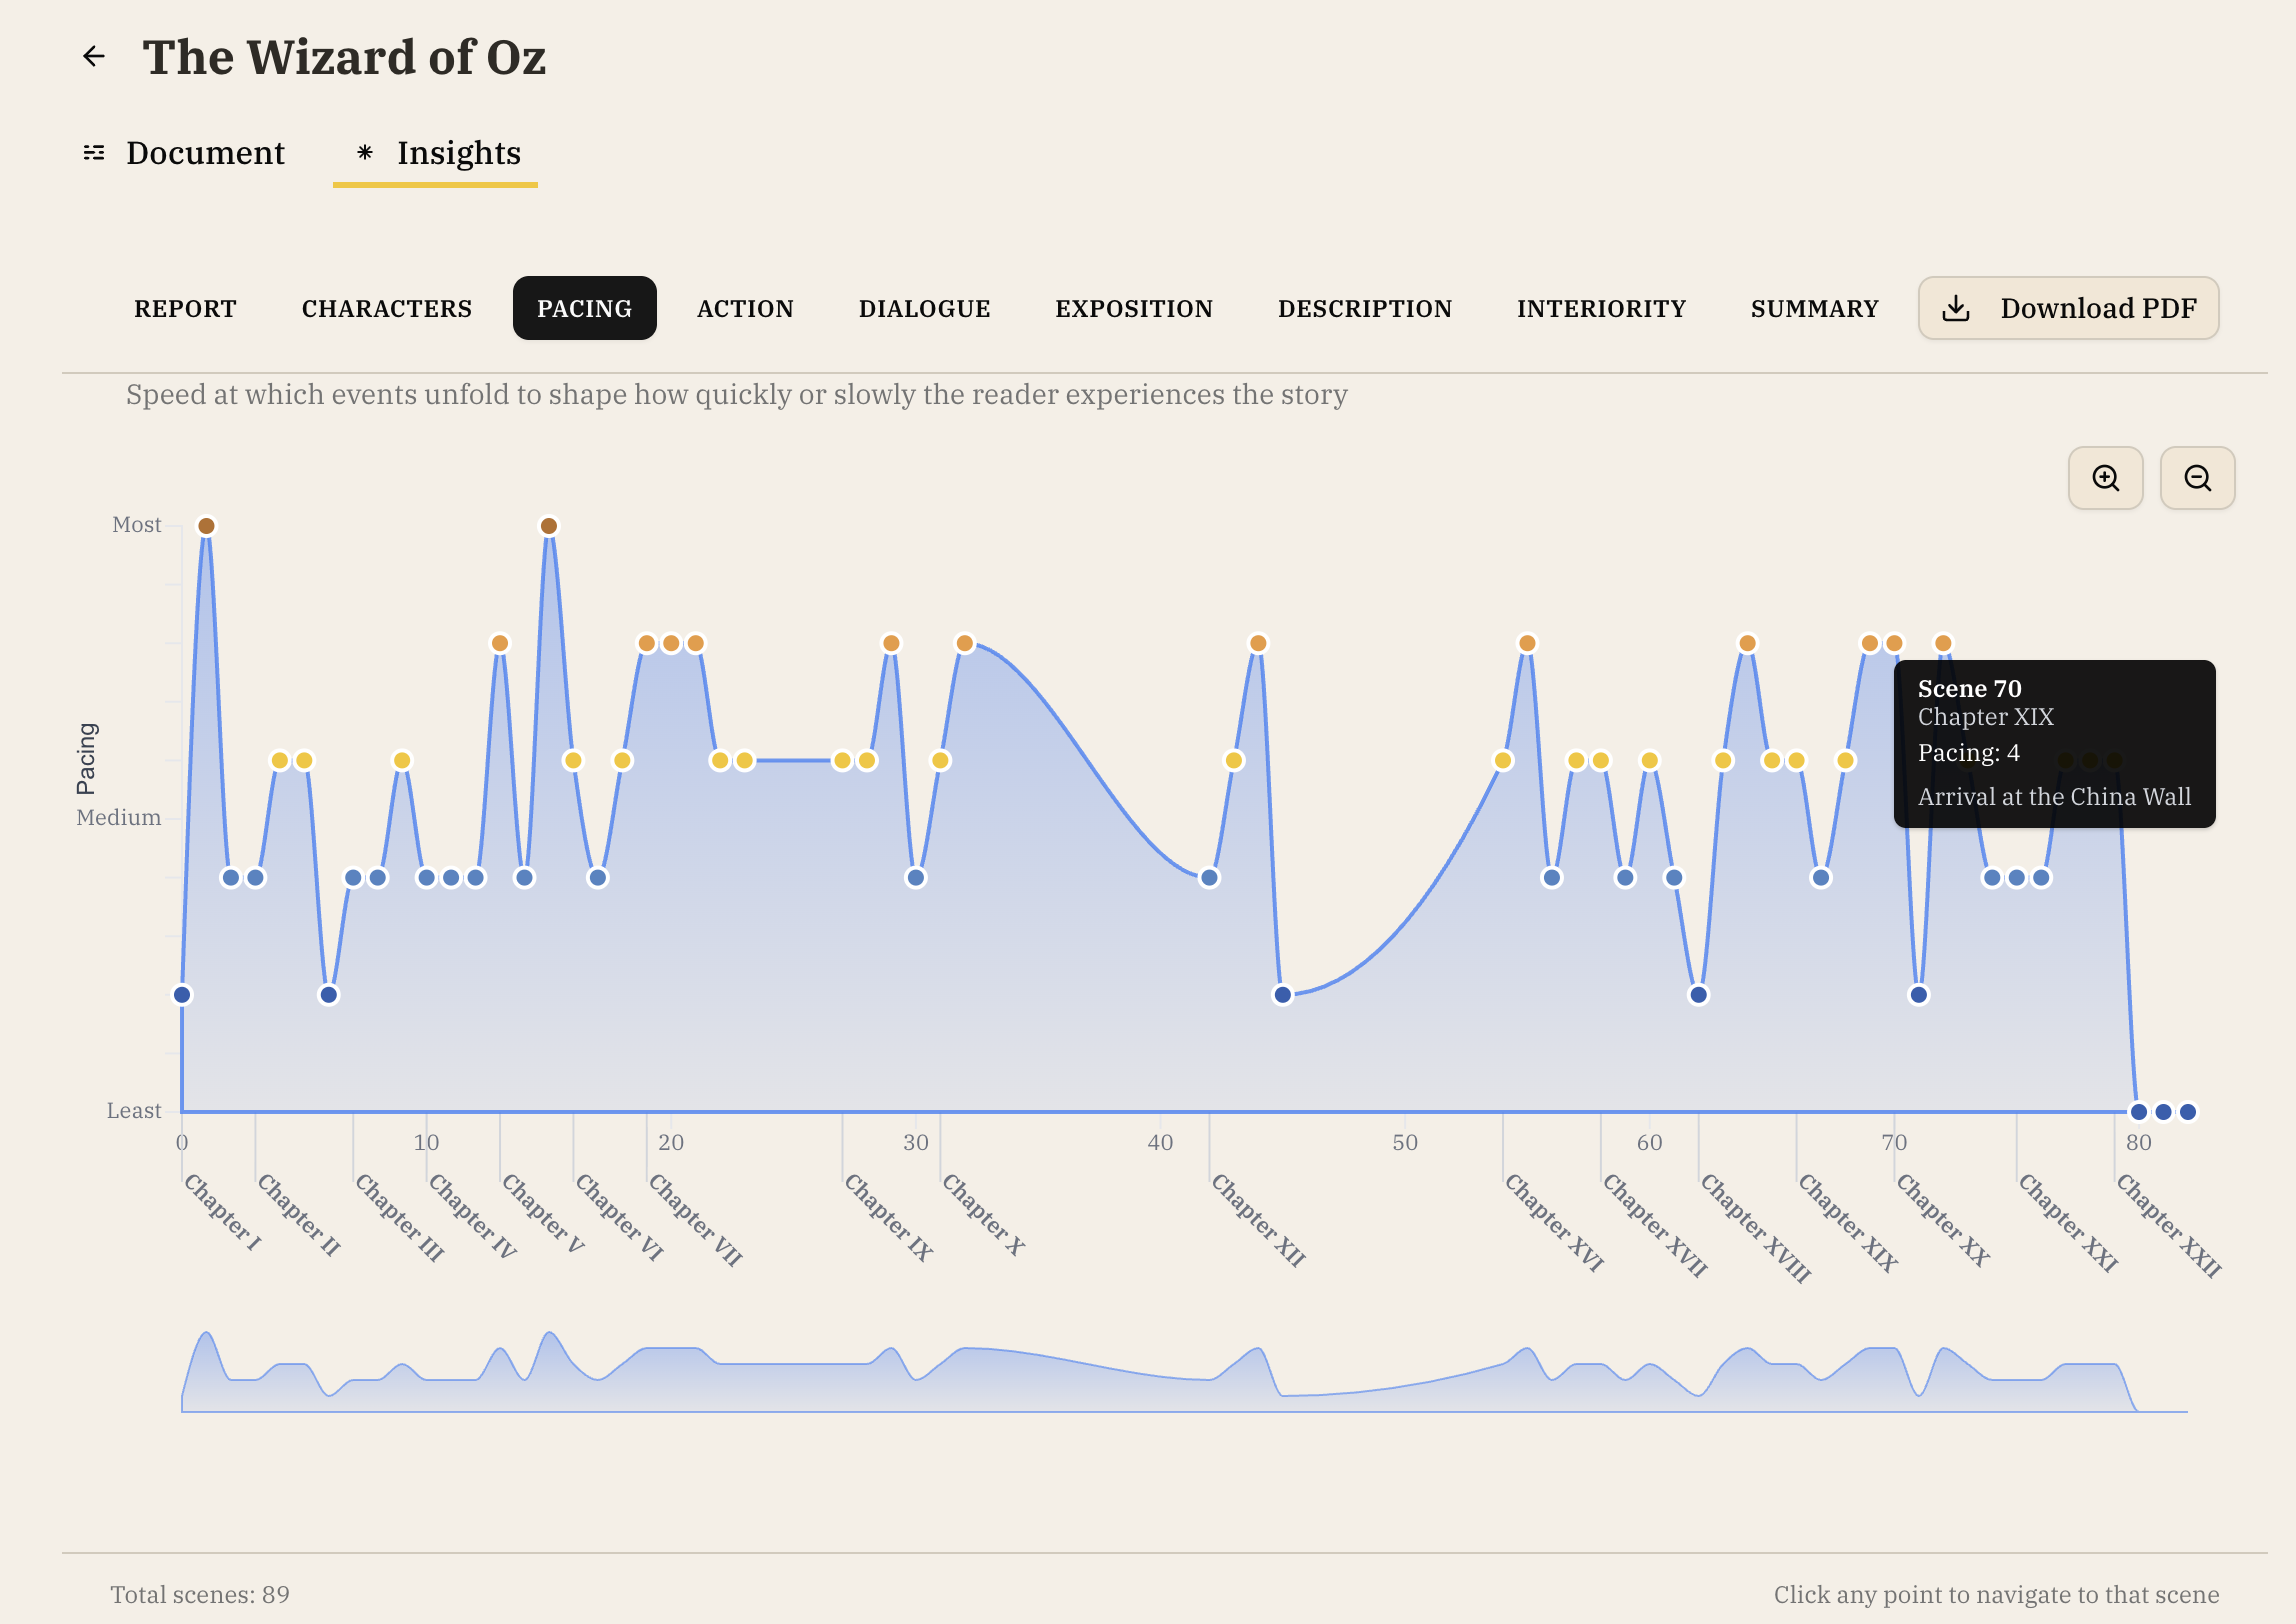
Pacing Graph
- Identifies slow spots and high-intensity moments in your manuscript
- Click any point to jump to that chapter in your manuscript
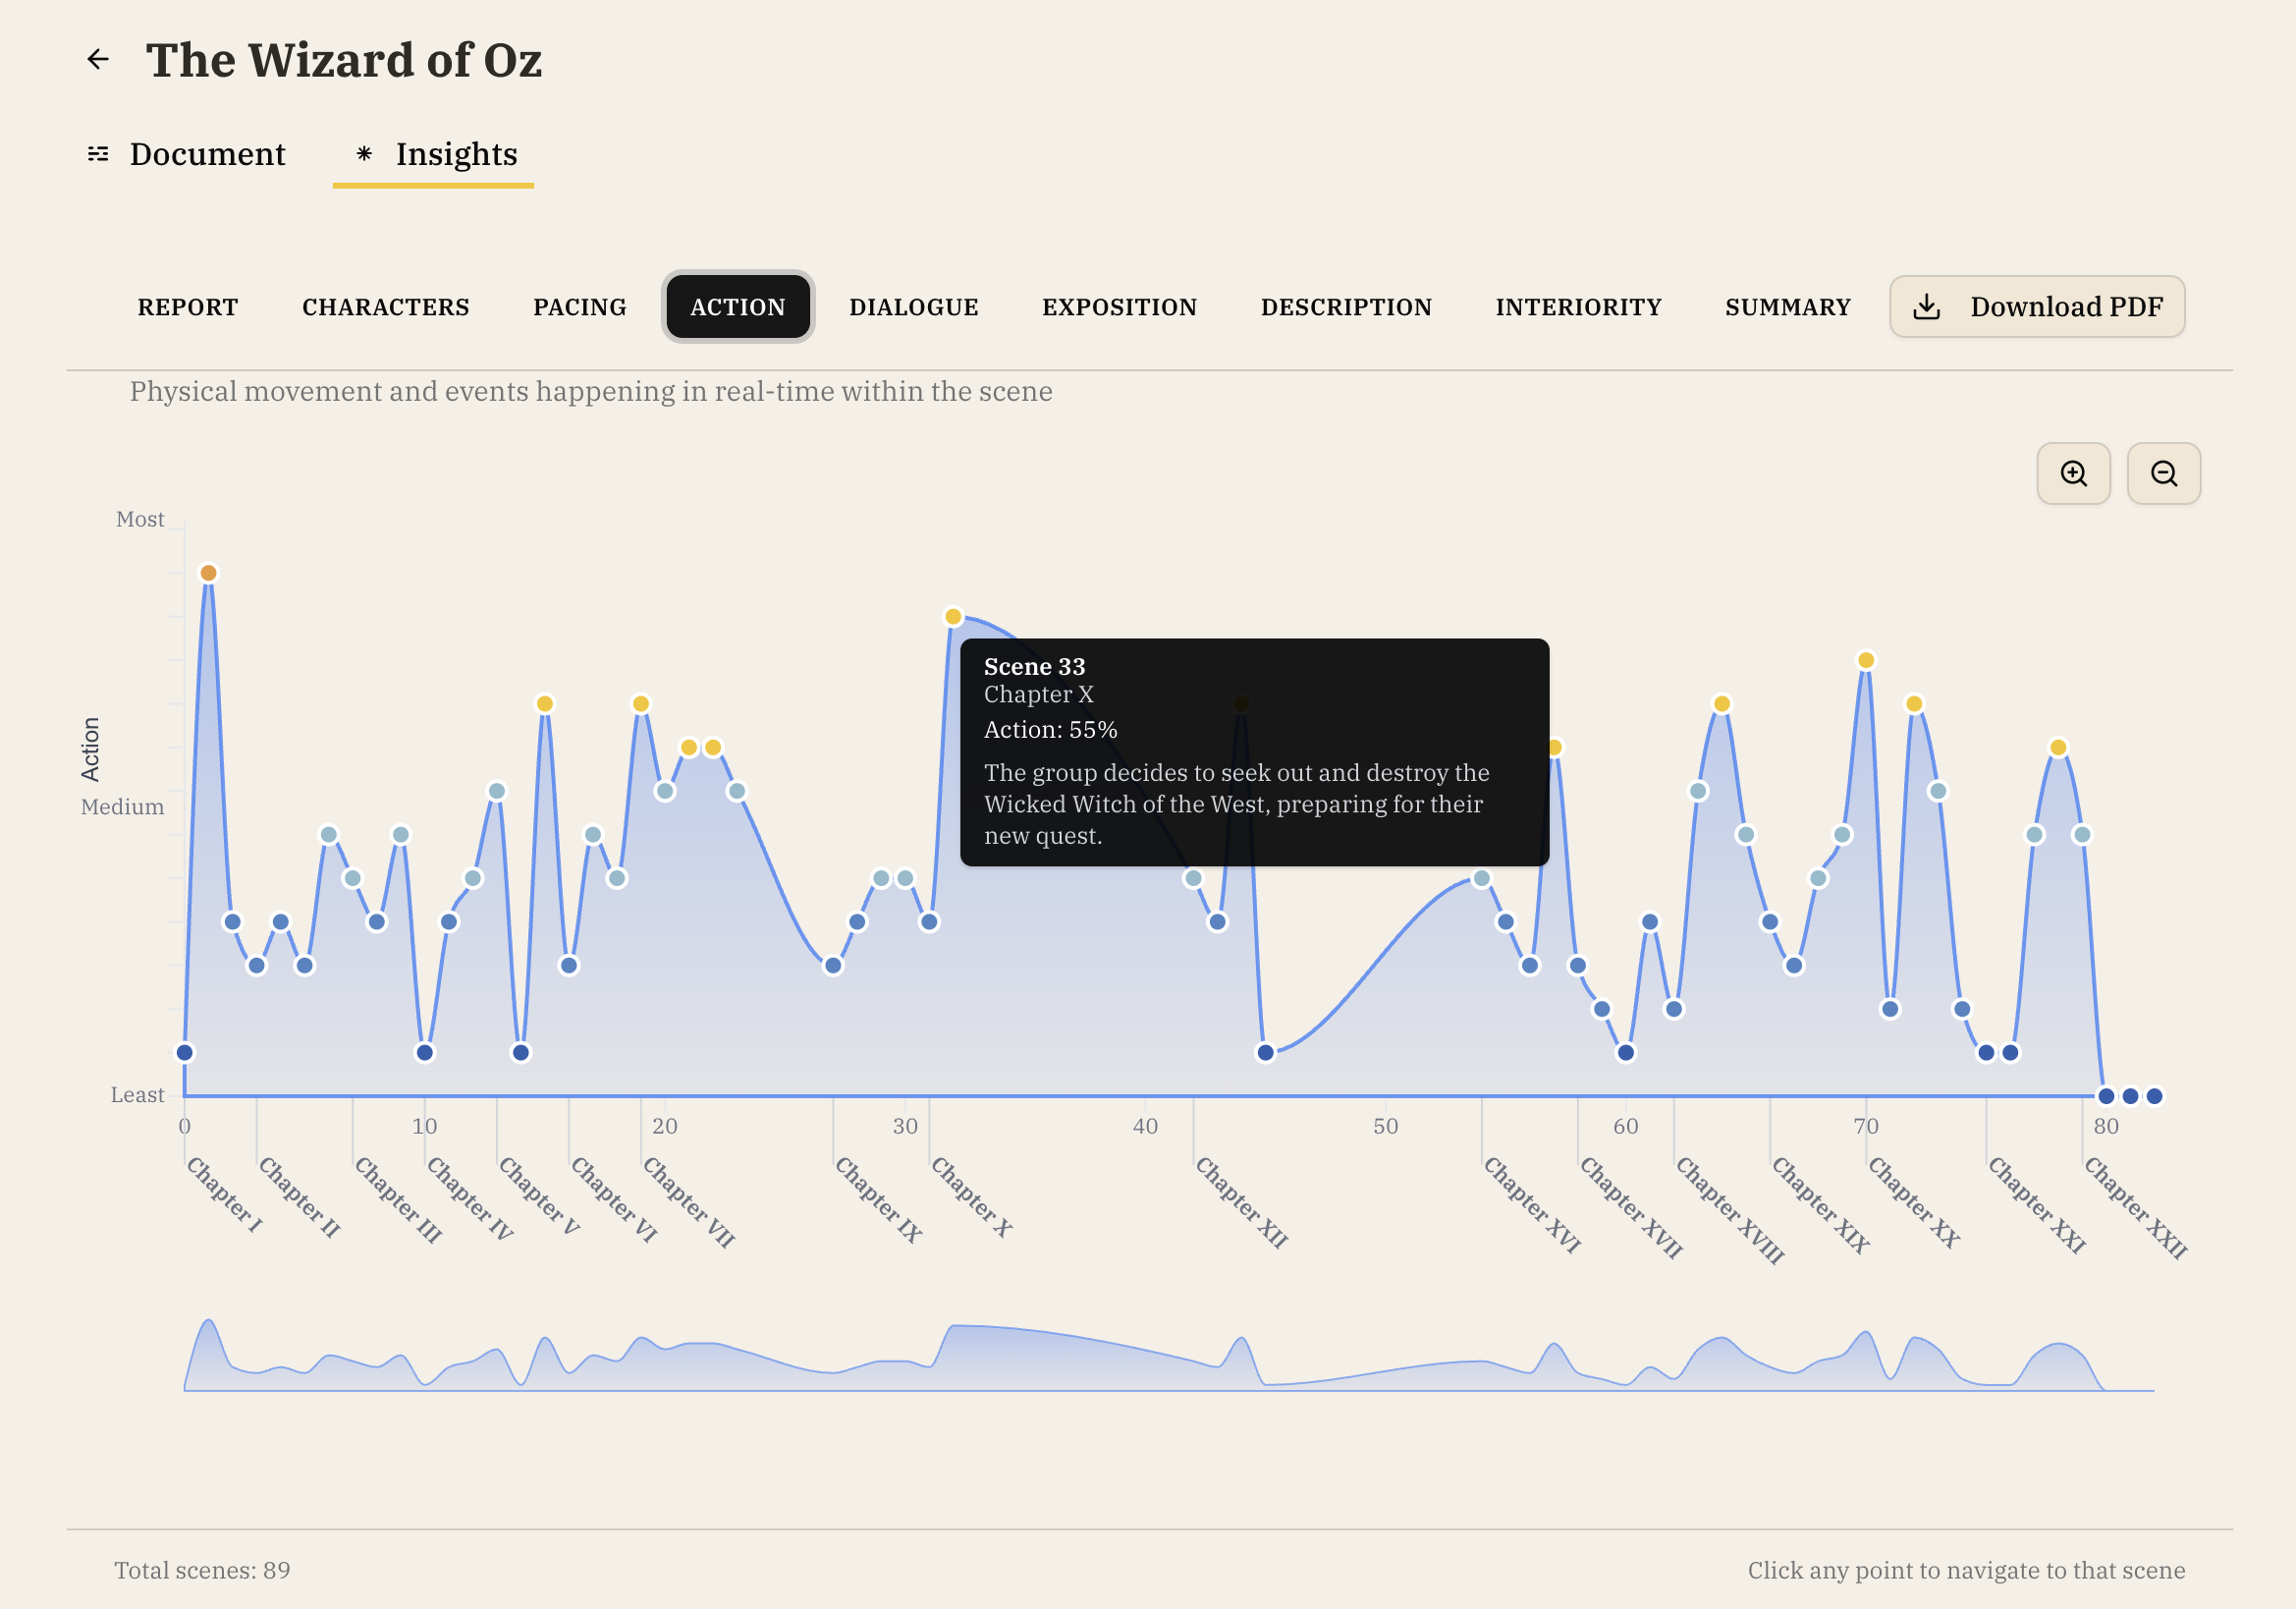
Action Graph
- Identifies the most and least action-packed chapters in your manuscript
- Click any point to jump to that chapter in your manuscript
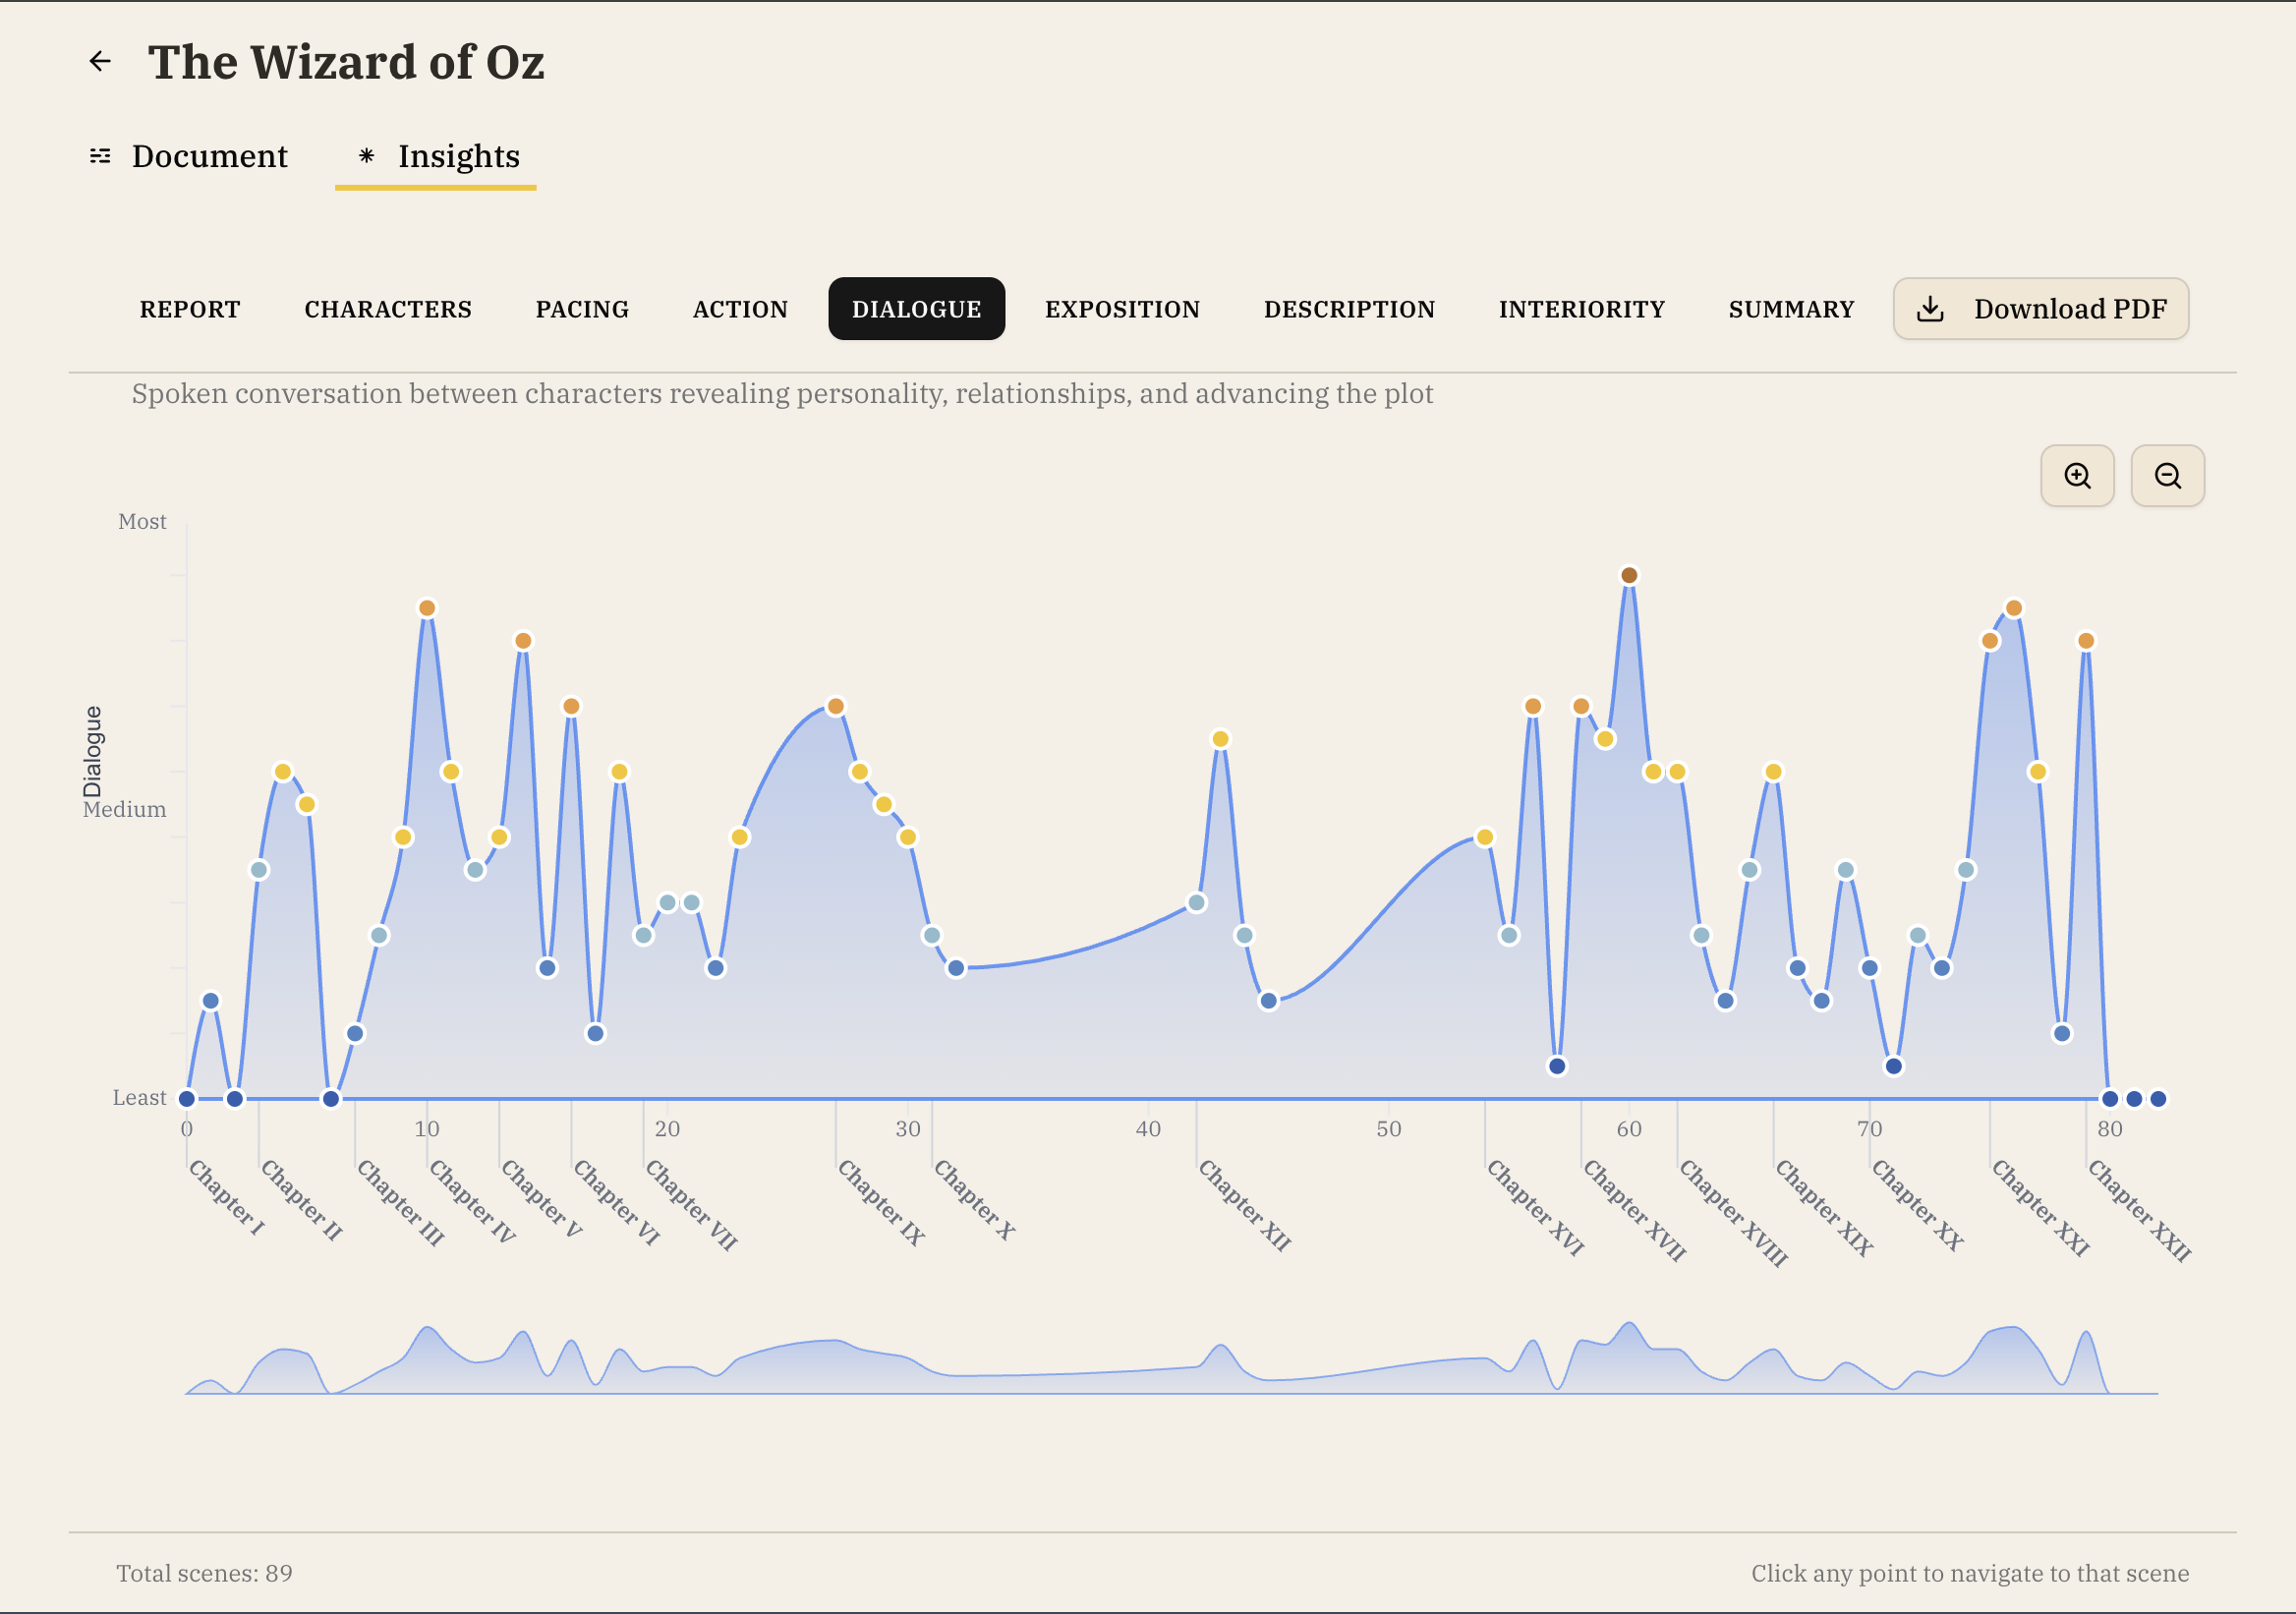
Dialog Graph
- Highlights the chapters with the most and the least dialogue
- Click any point to jump to that chapter in your manuscript
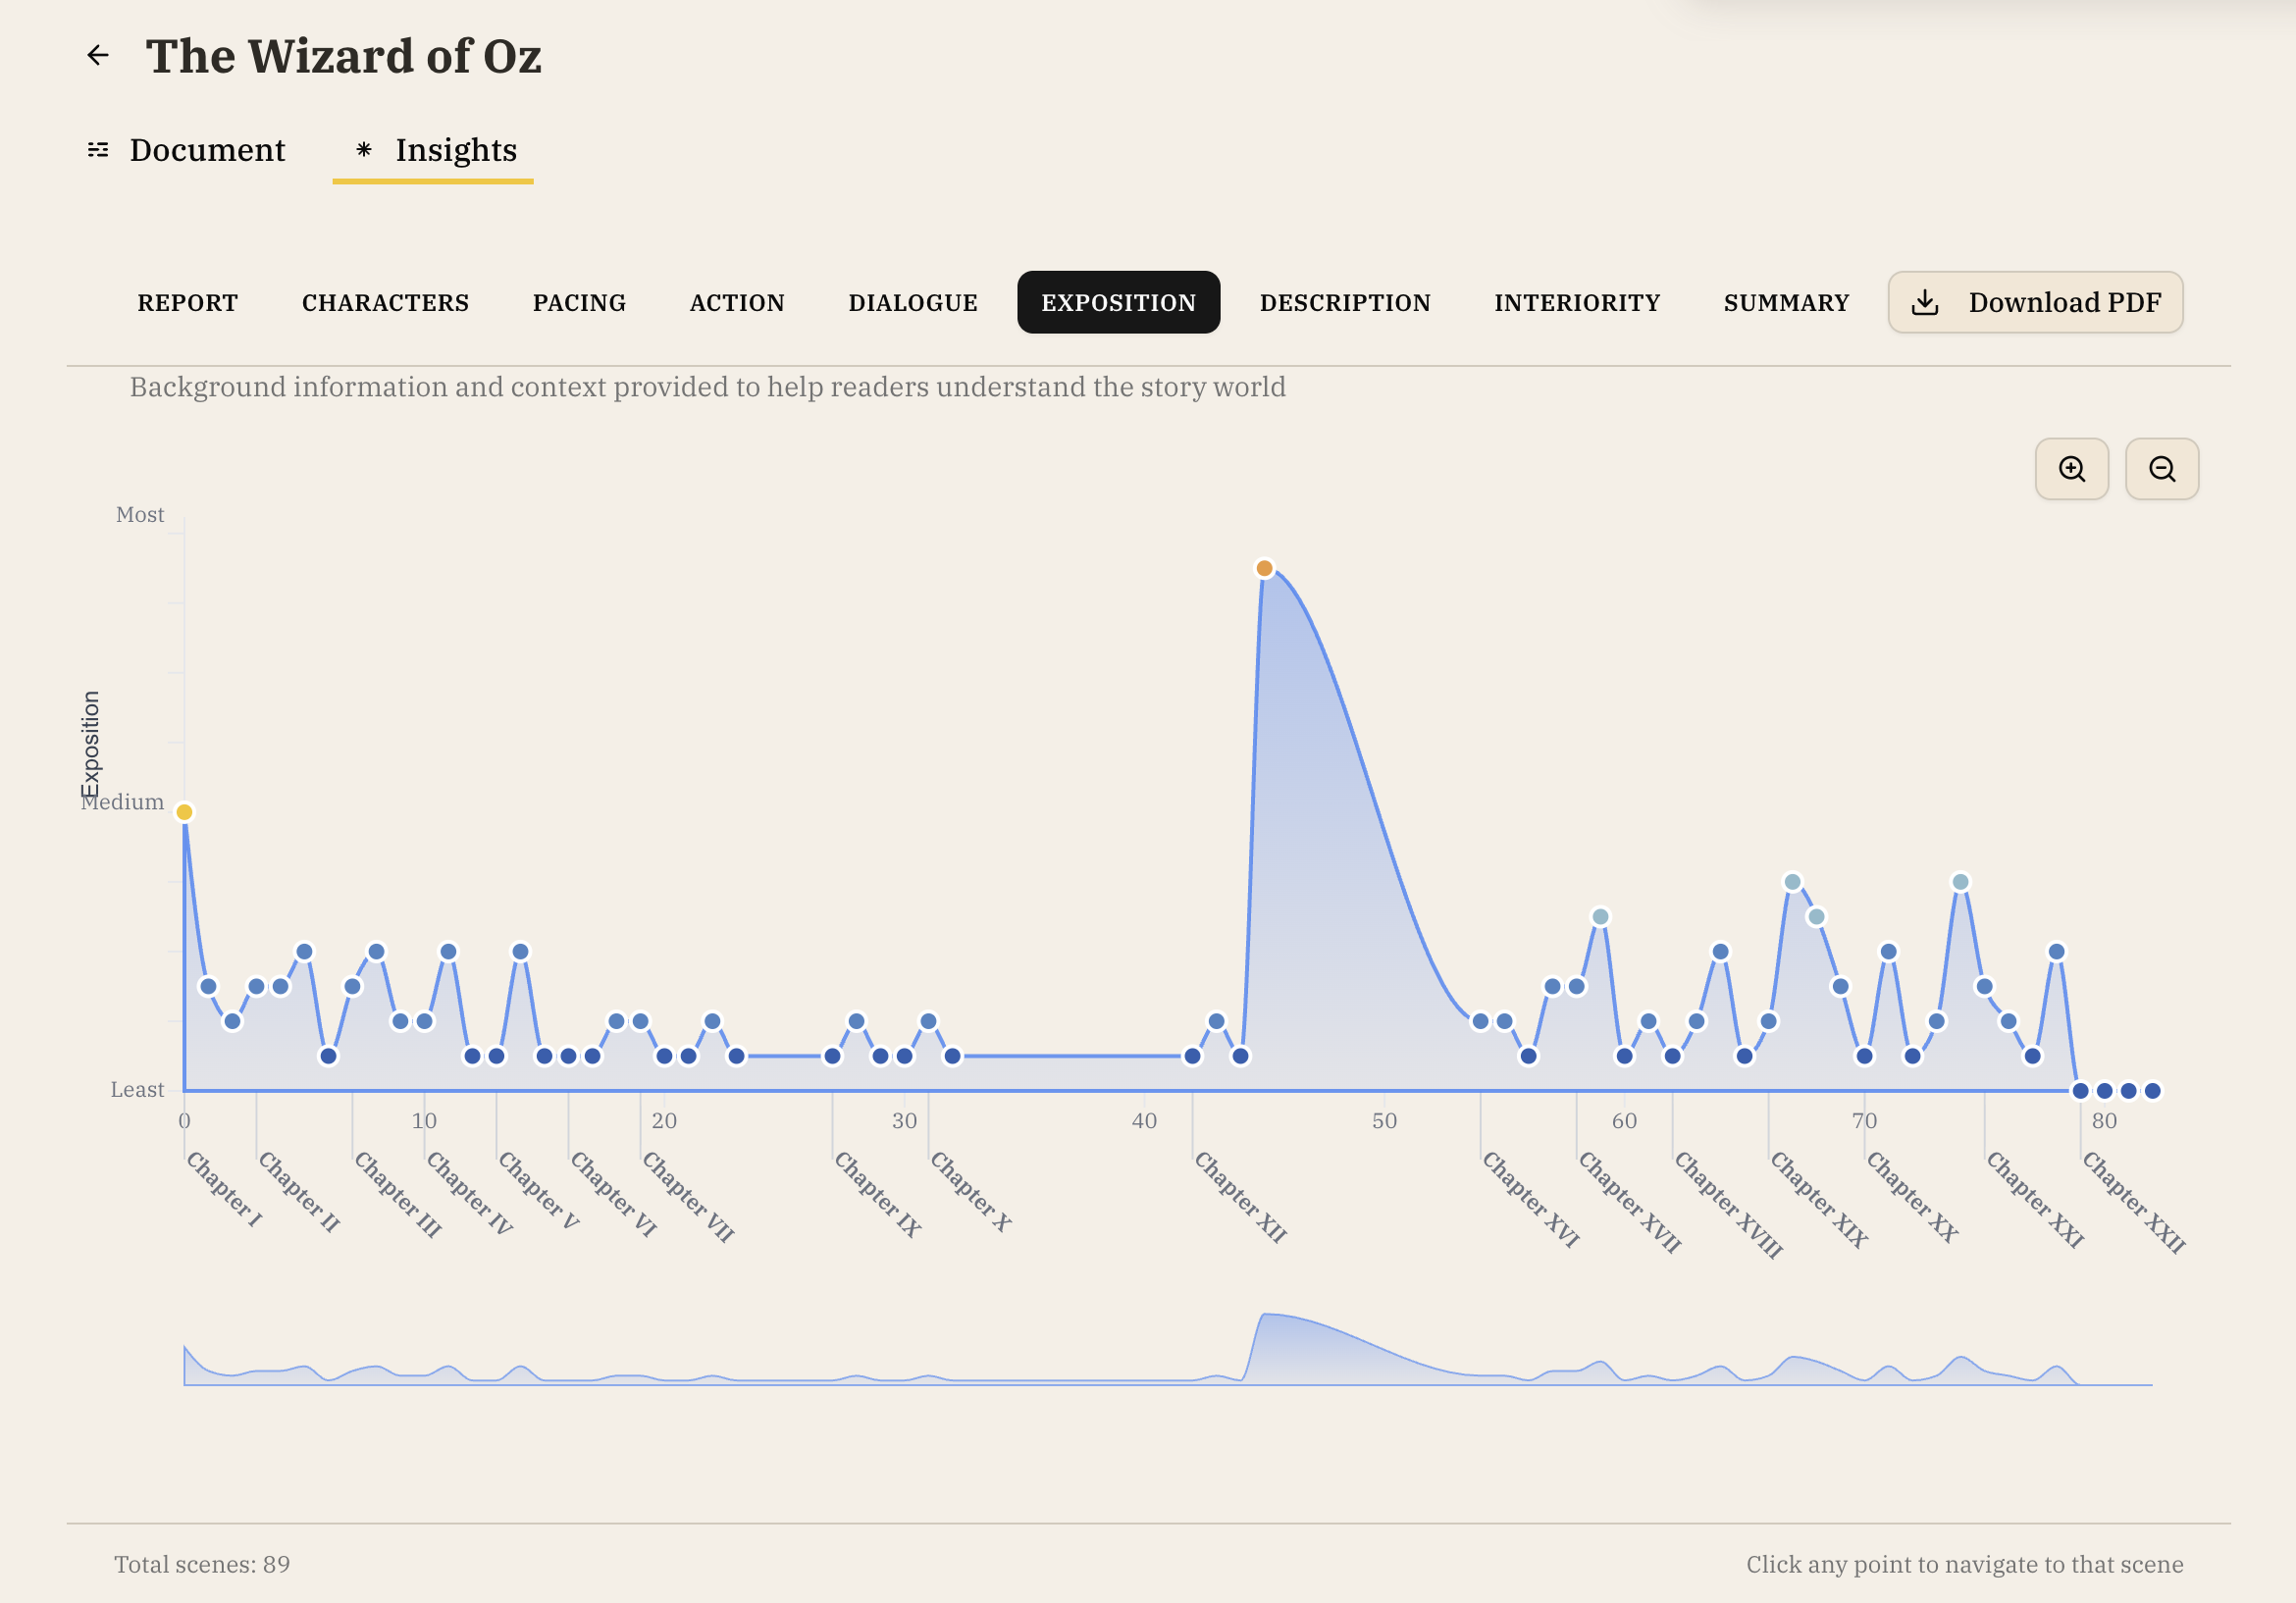
Exposition Graph
- Shows where background information and context is shared with readers to help them understand the world that the story takes place in
- Click any point to jump to that chapter in your manuscript
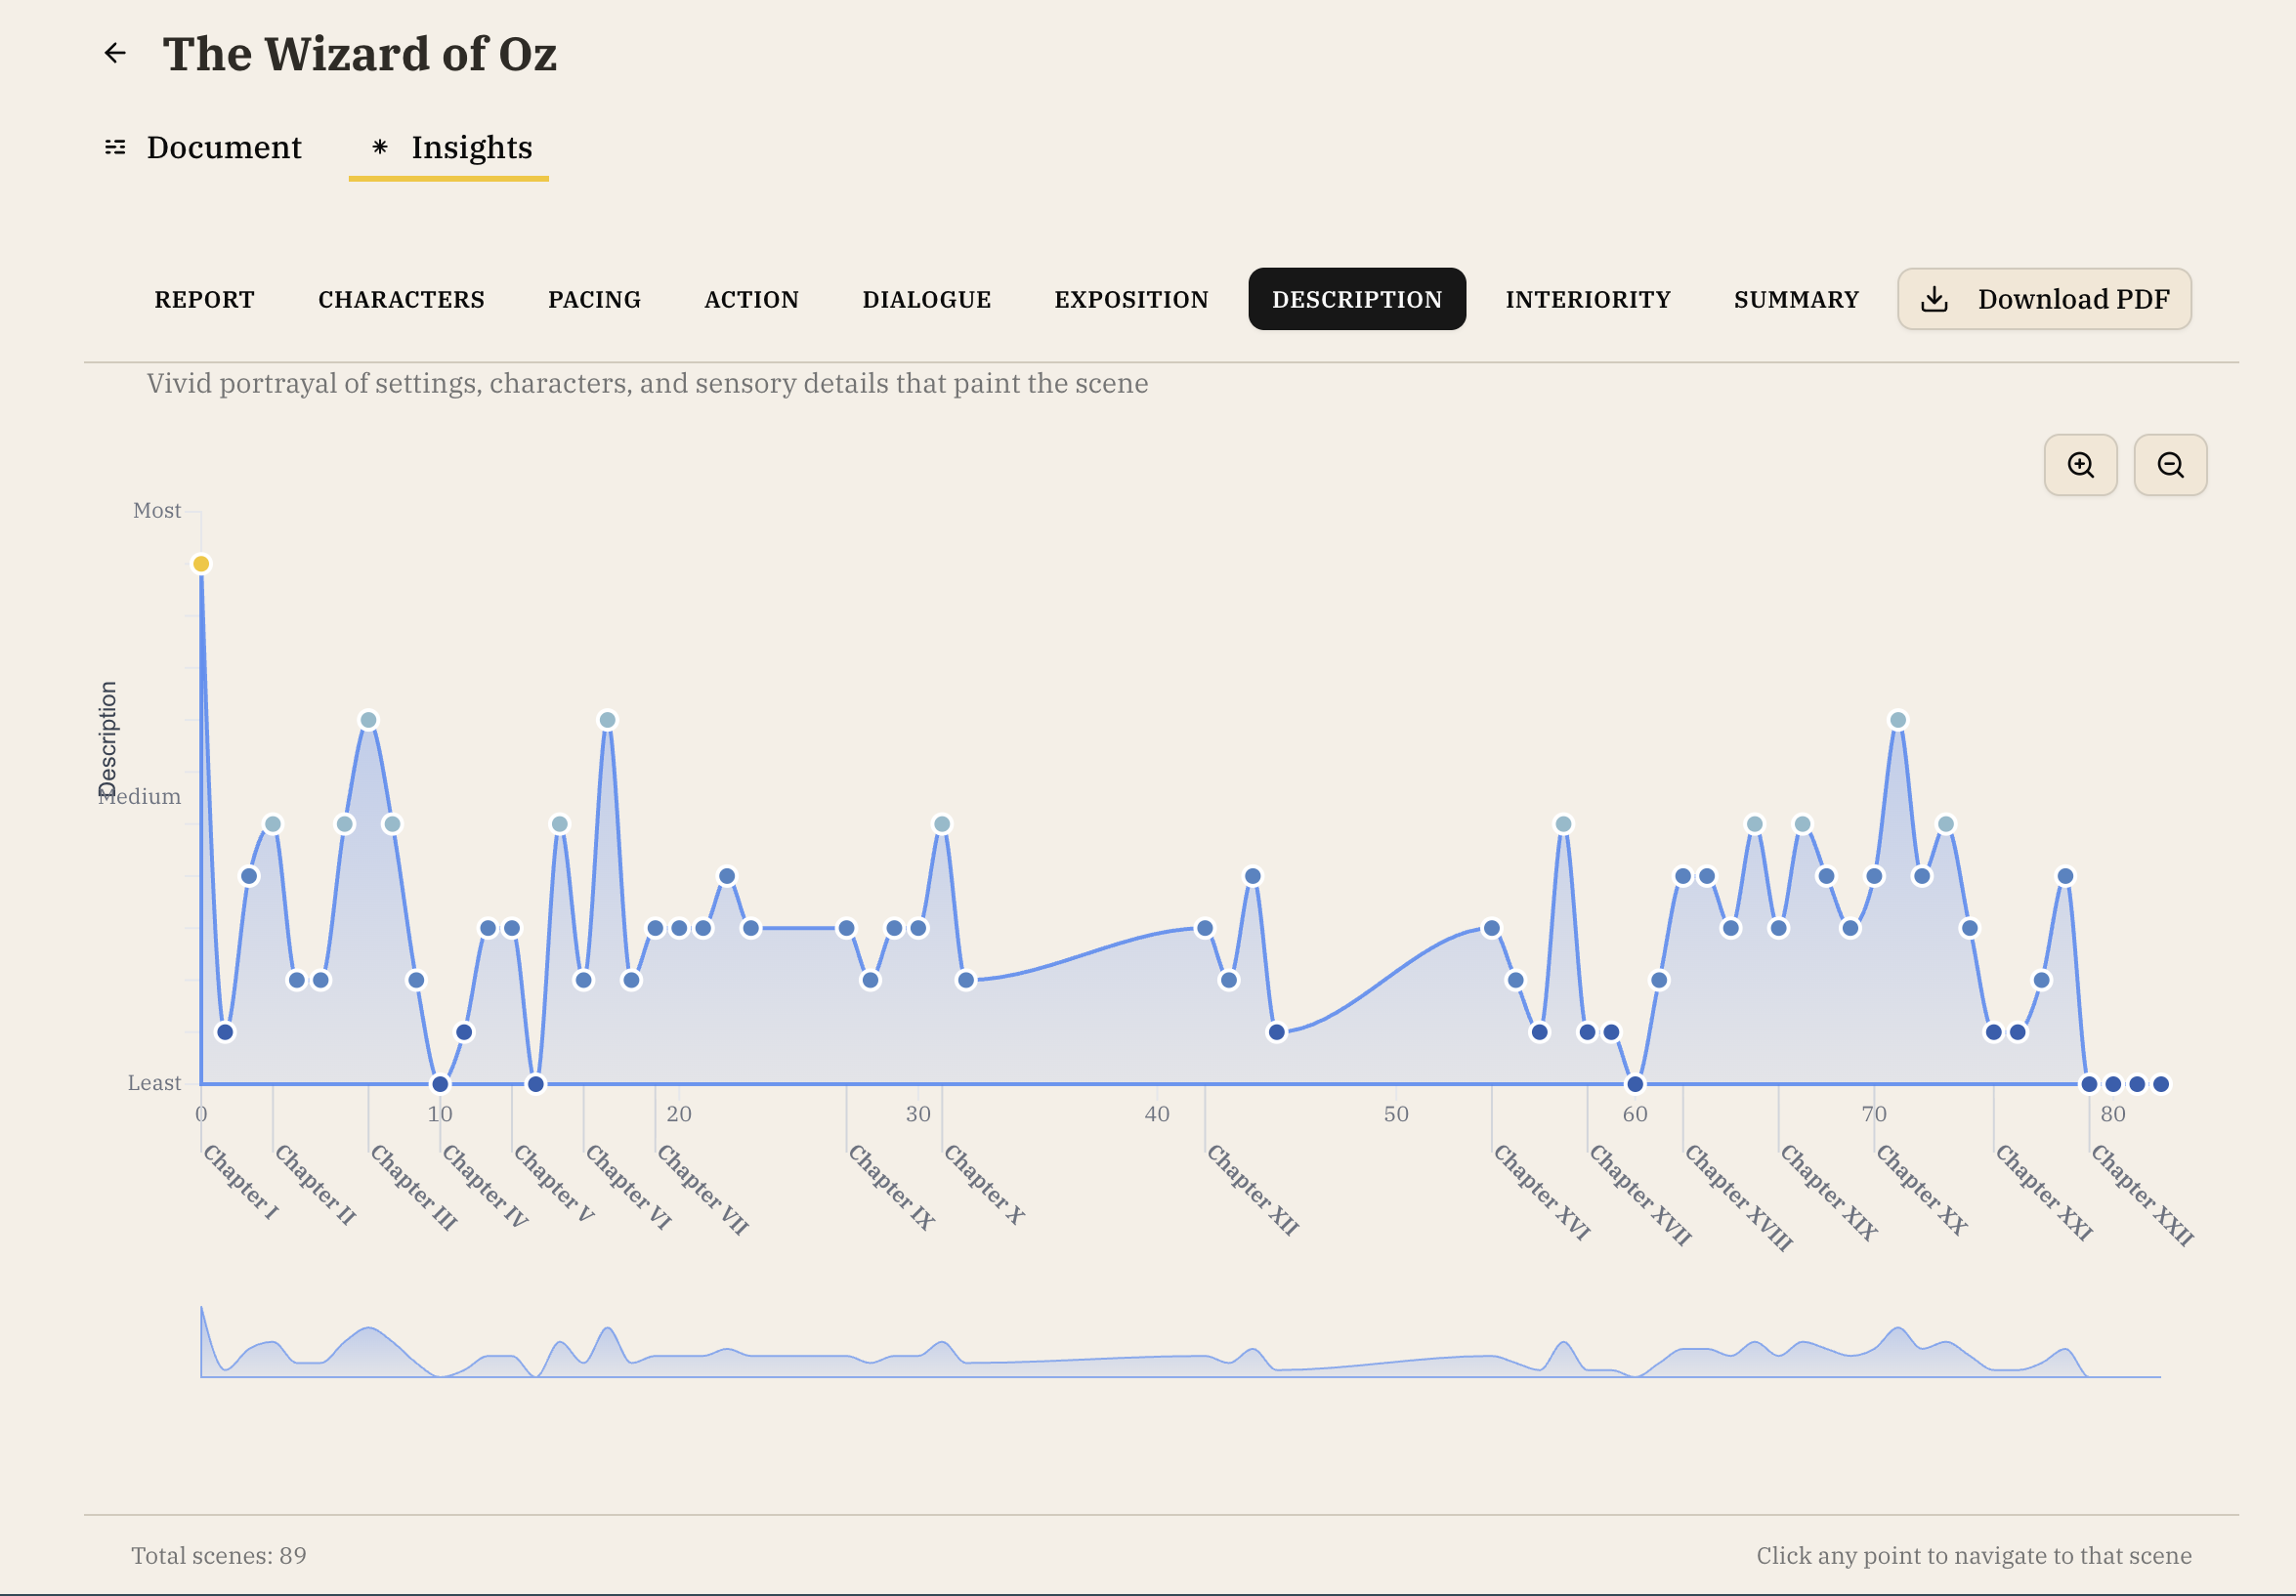
Description Graph
- Shows where the settings, characters, and sensory details that paint the story appear
- Click any point to jump to that chapter in your manuscript
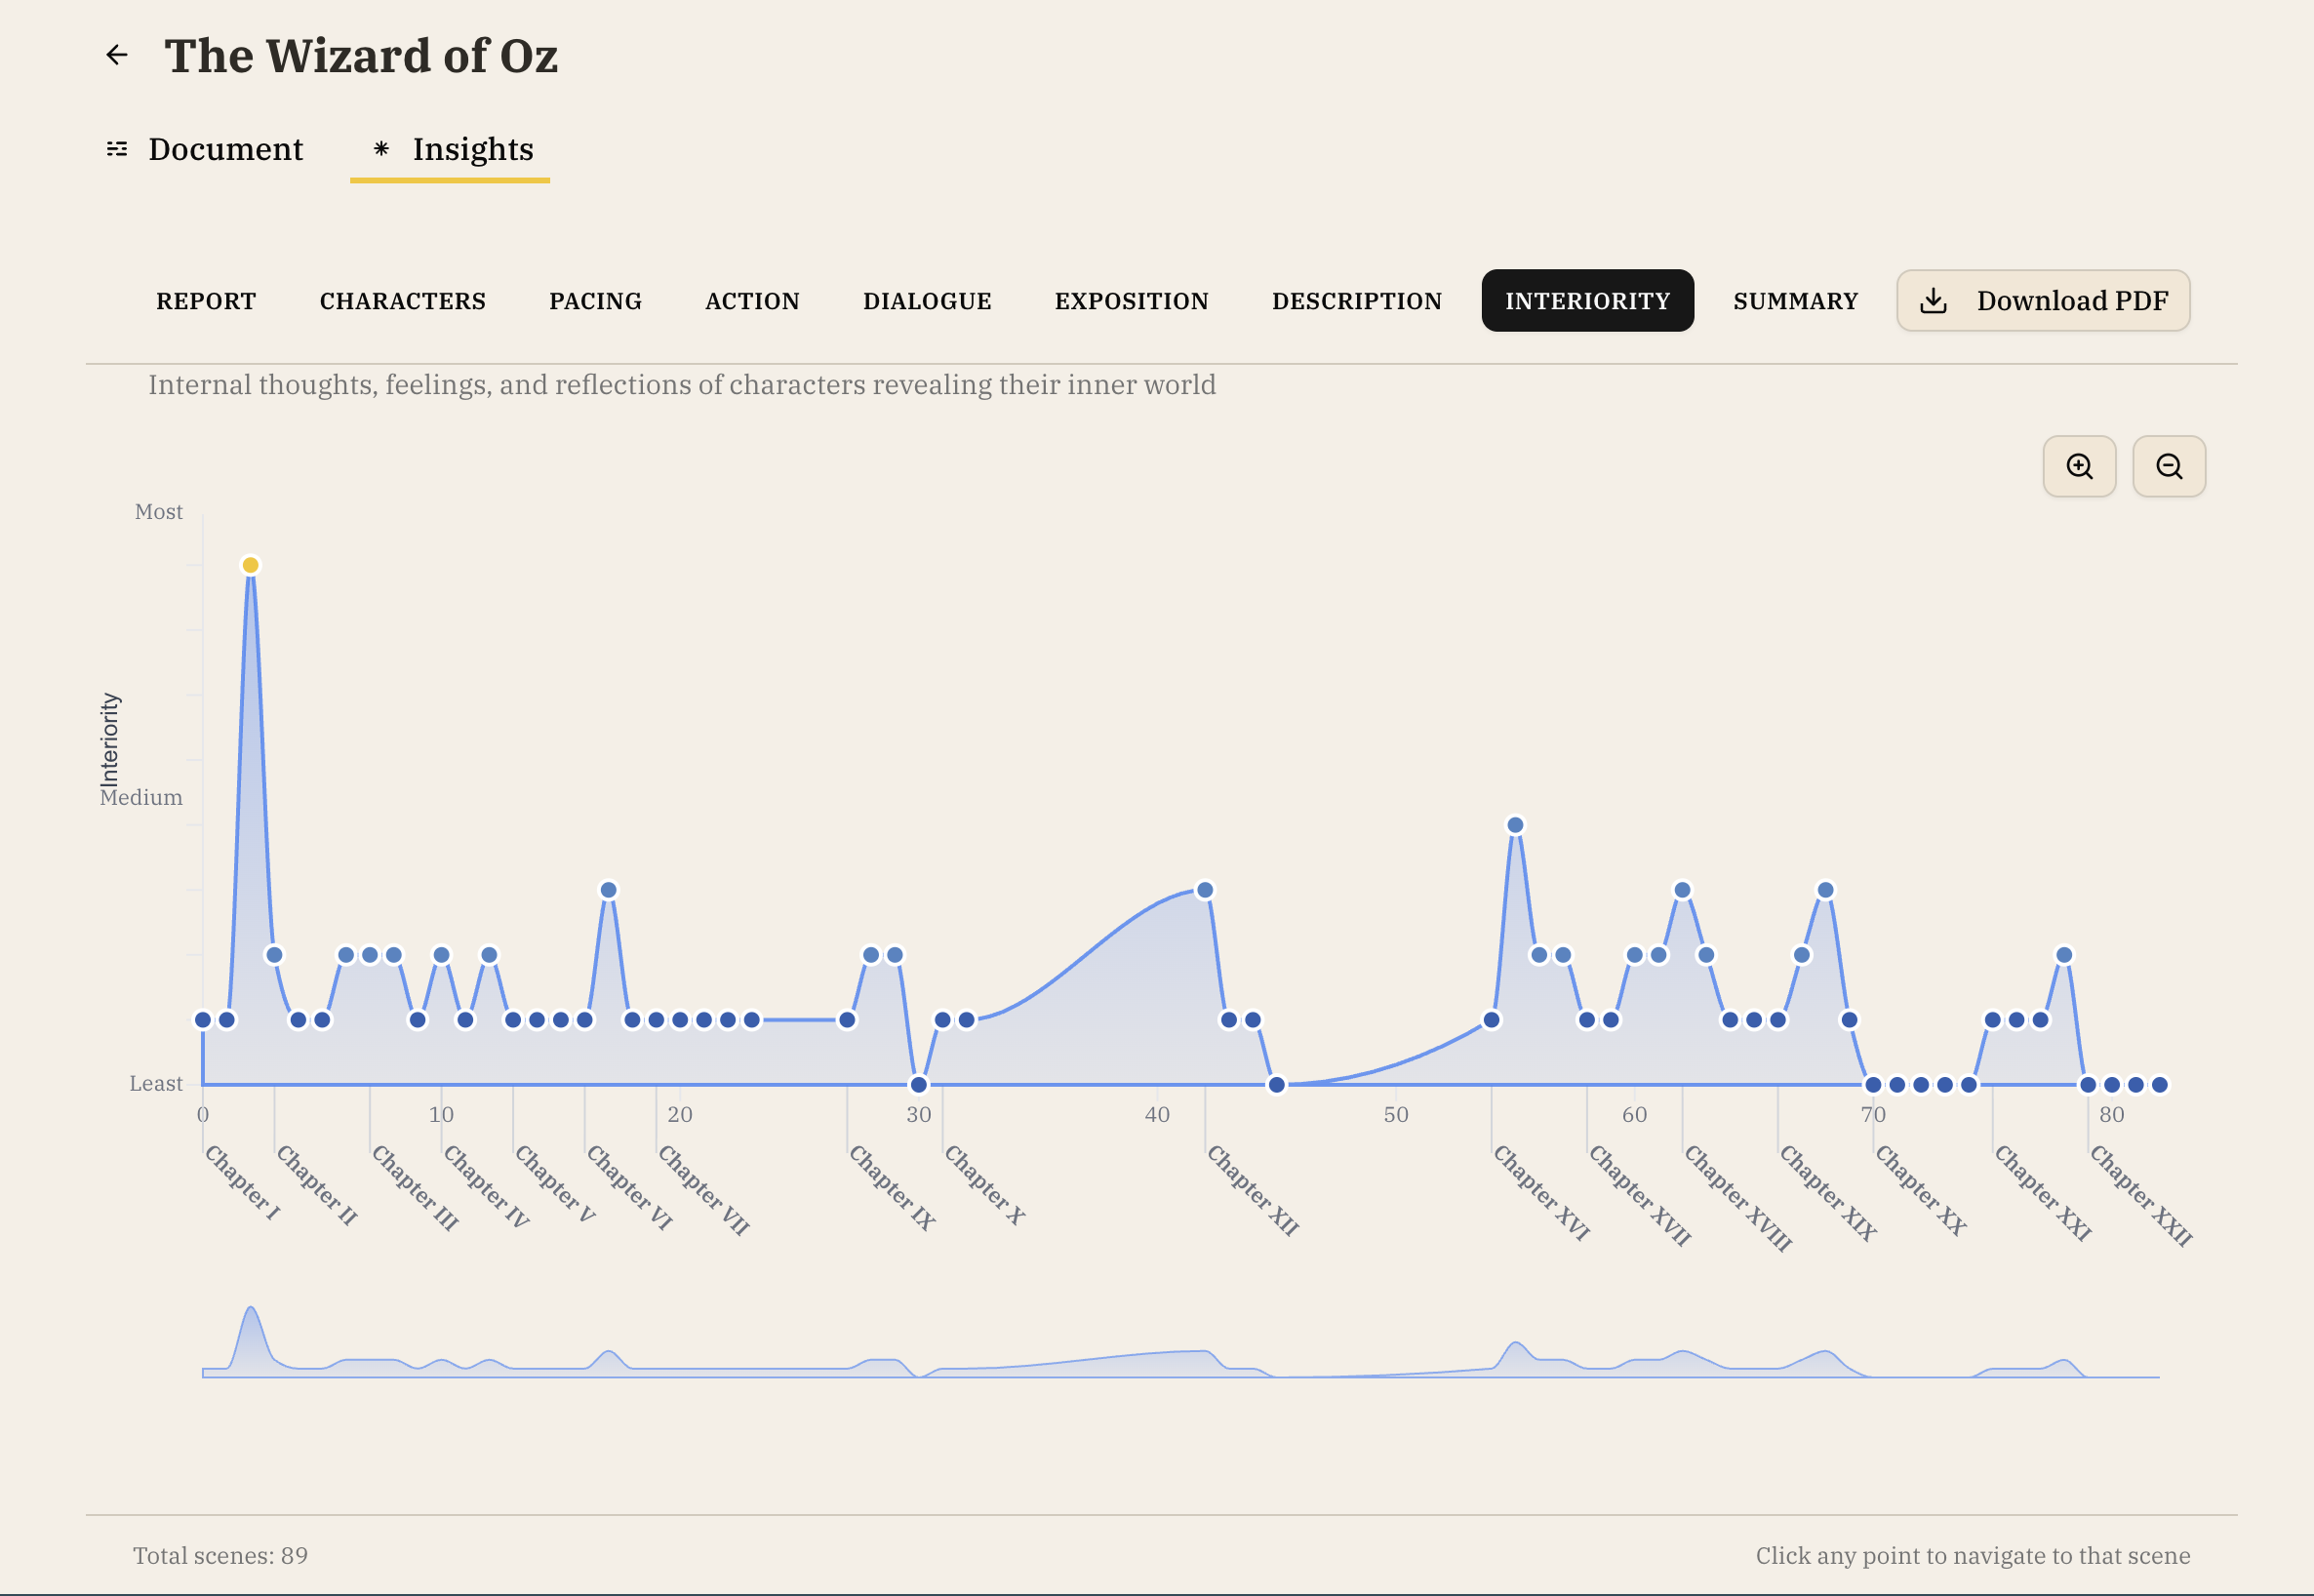
Interiority Graph
- Shows where the internal thoughts, feelings, and reflections of characters are shared to reveal their inner world
- Click any point to jump to that chapter in your manuscript
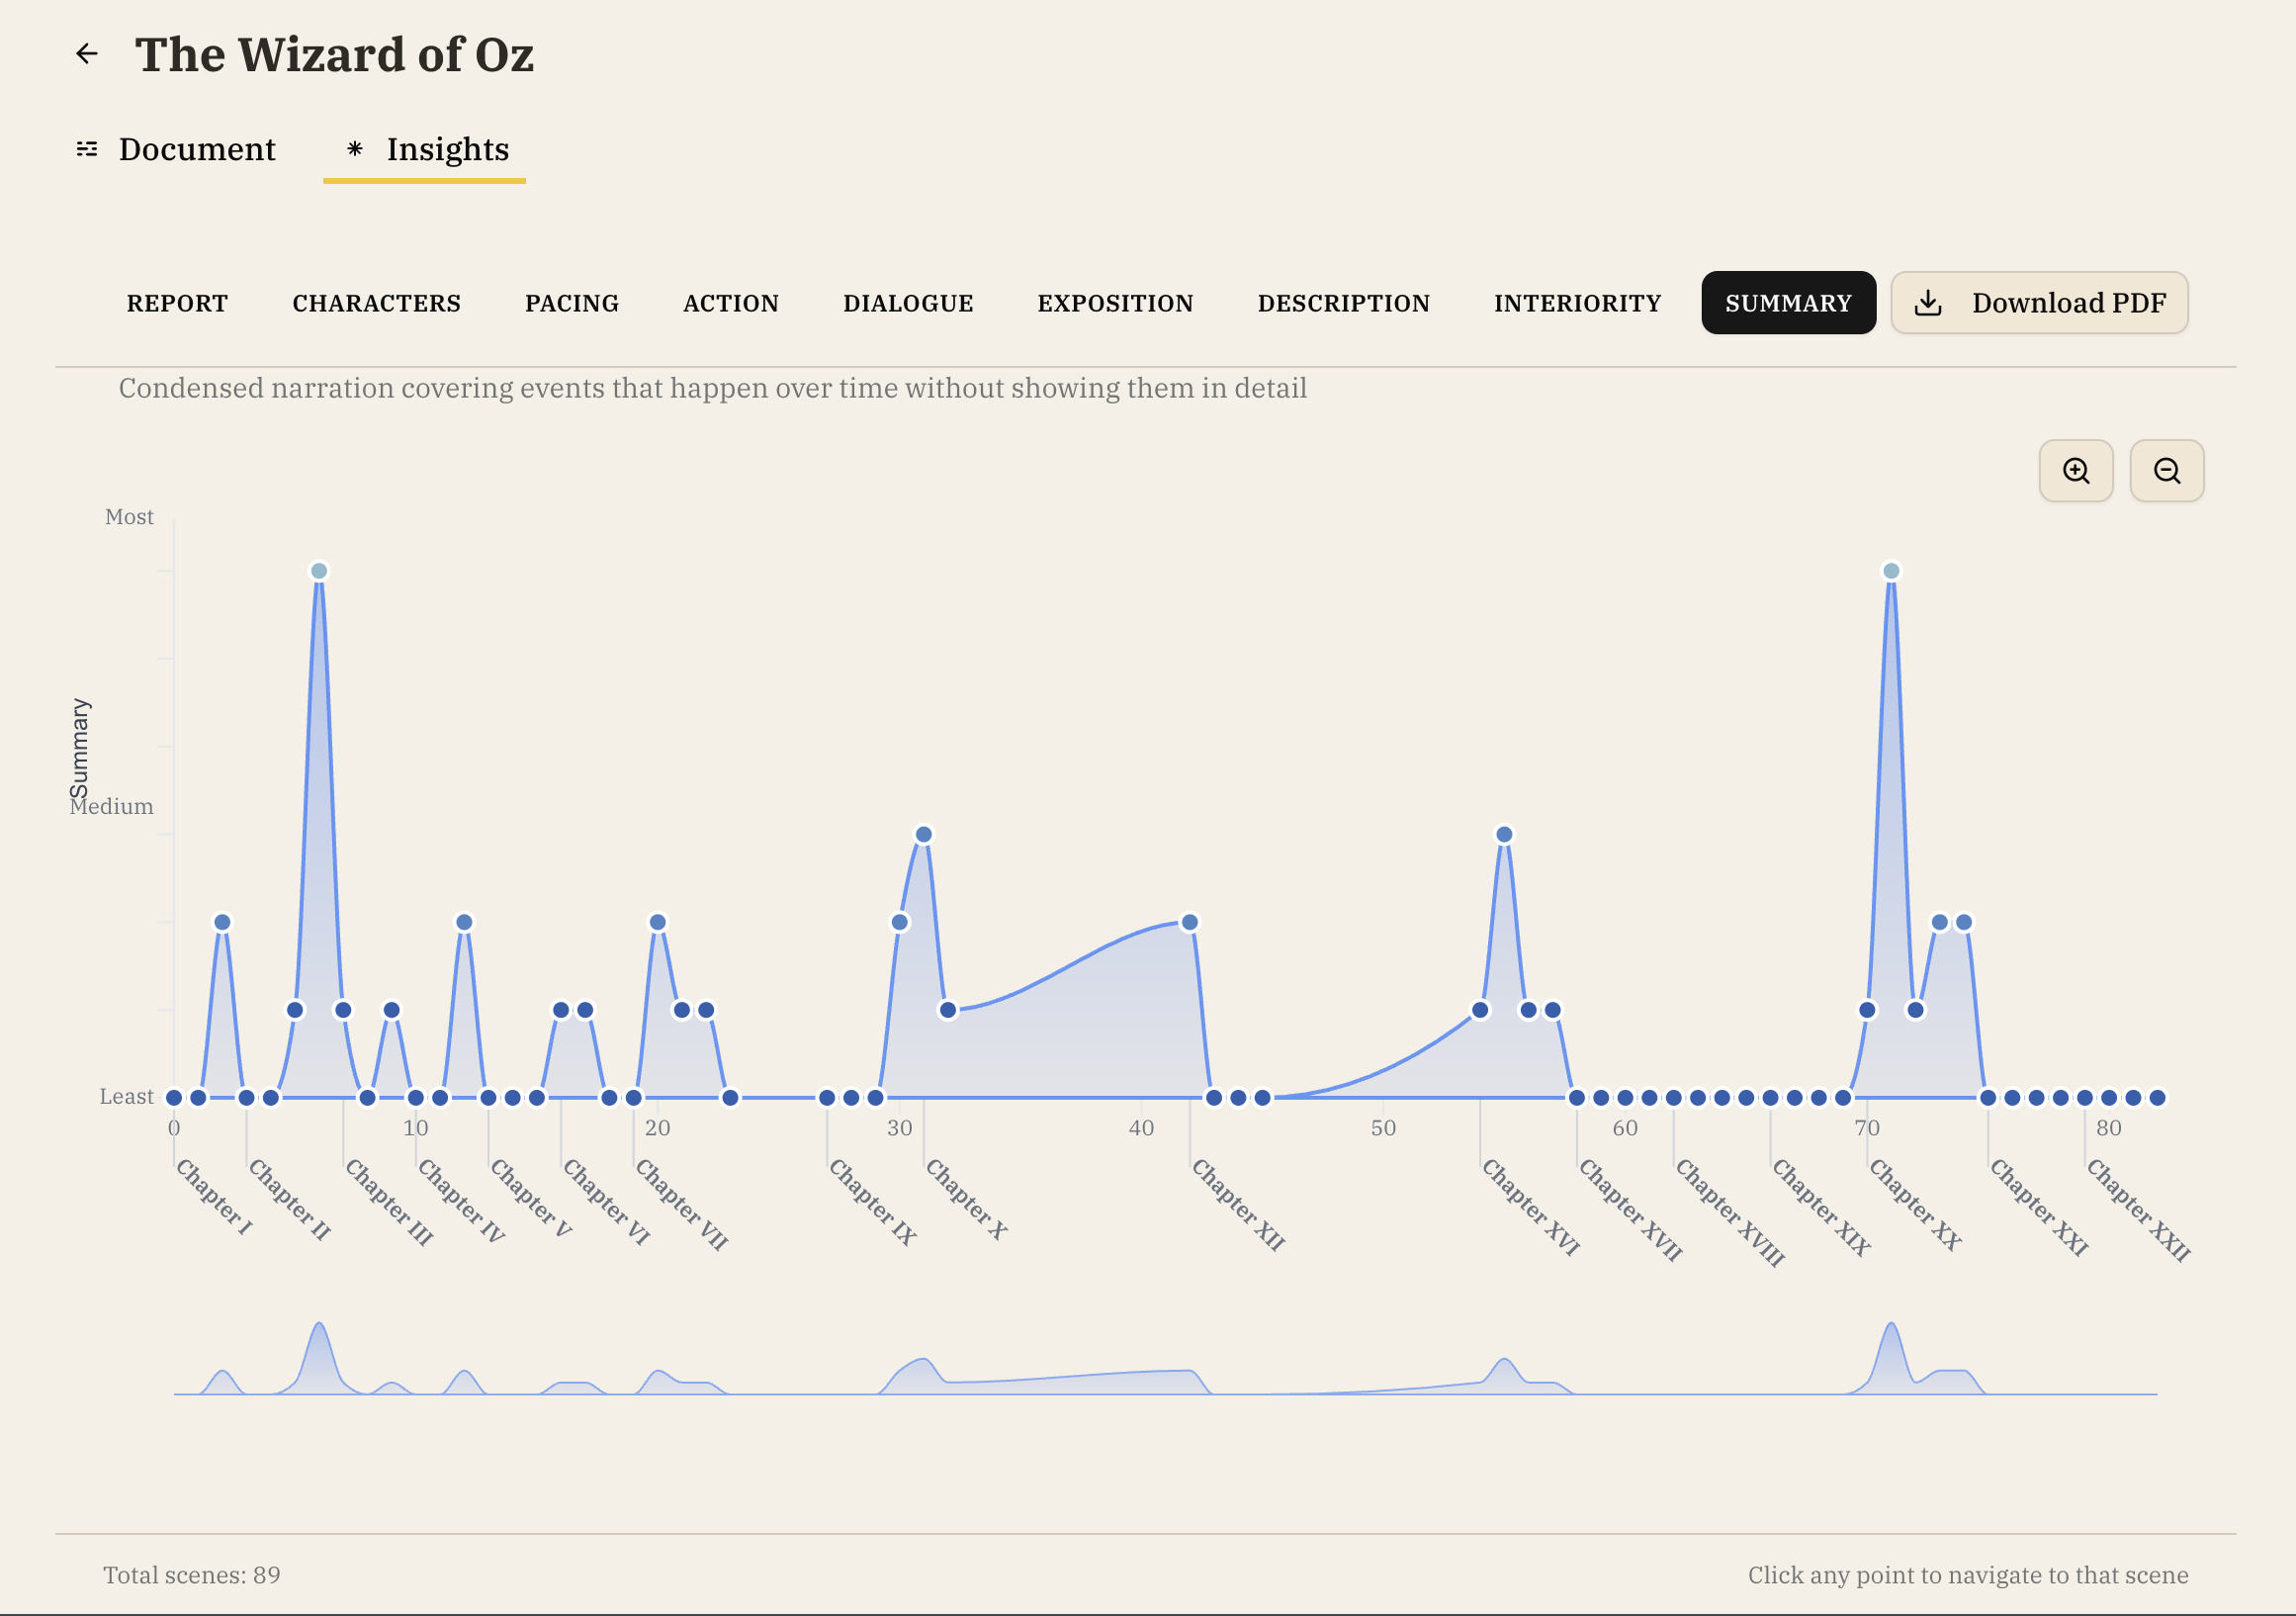
Summary Graph
- Shows where narration is condensed to cover events that happen over time without showing them in detail
- Click any point to jump to that chapter in your manuscript
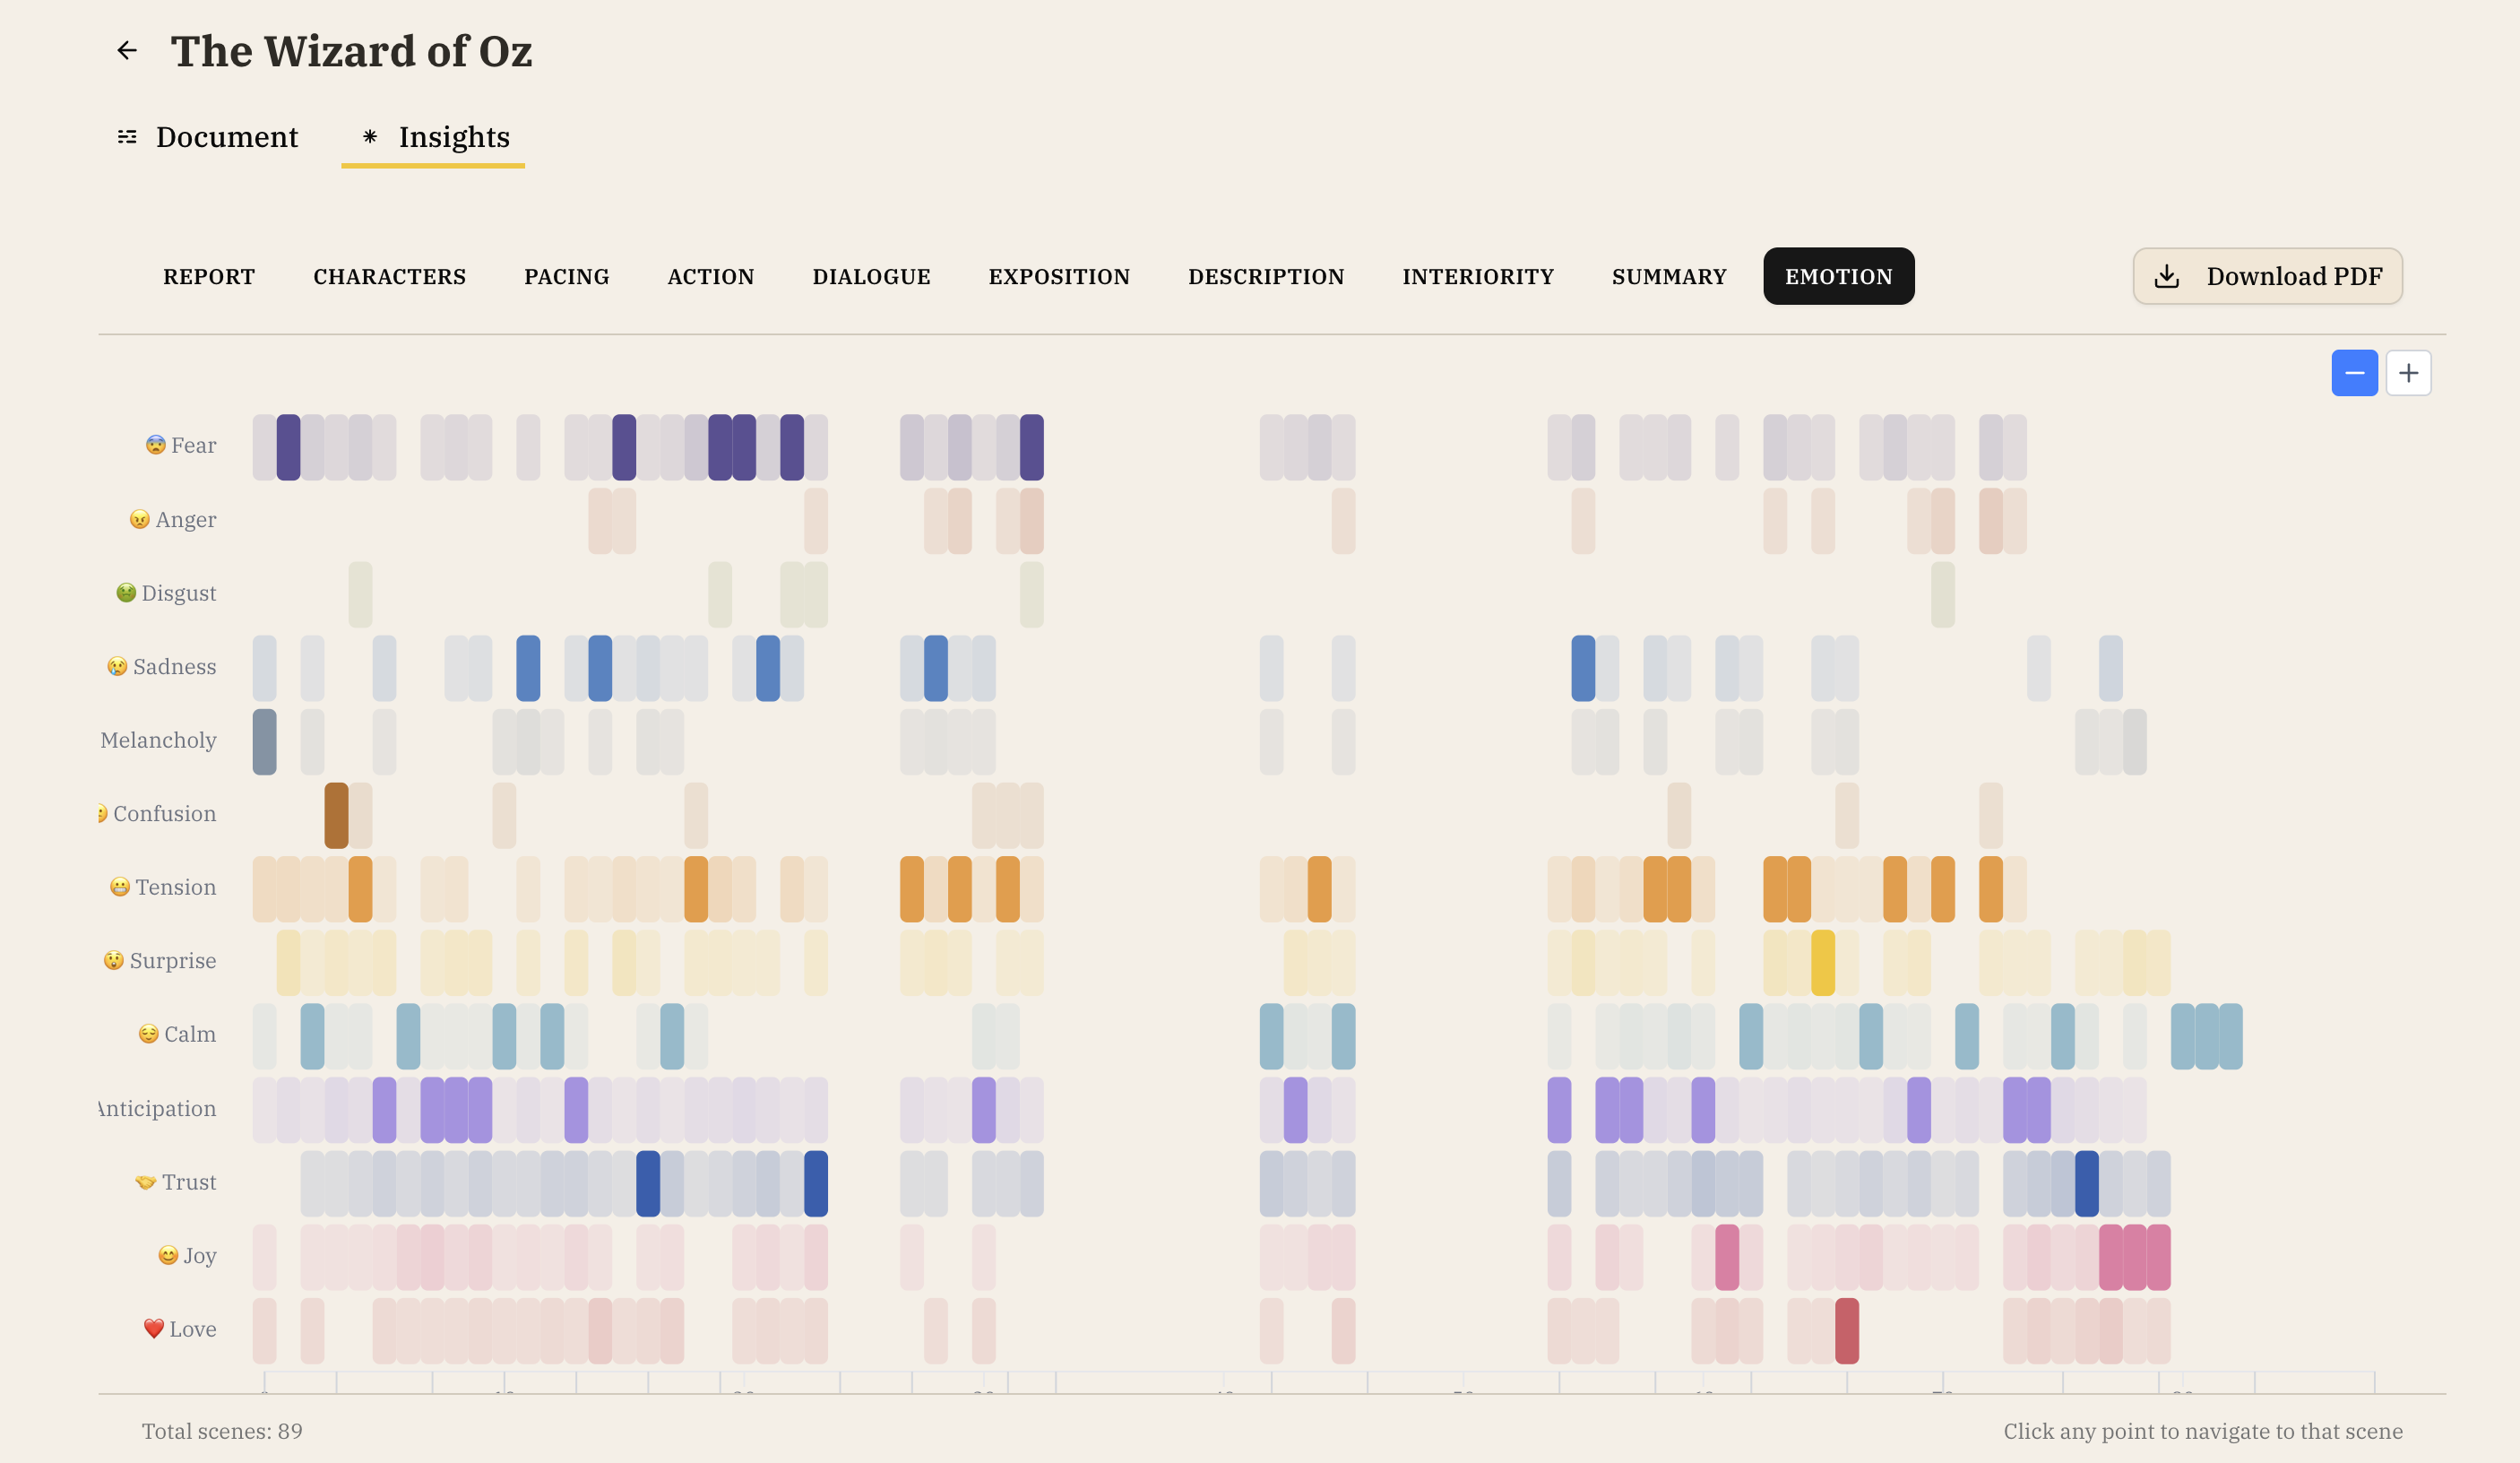
Emotion Heatmap
- Color-coded visualization of emotional tones across chapters
- Tracks emotions like joy, sadness, tension, anticipation
- Helps identify emotional variety and monotony
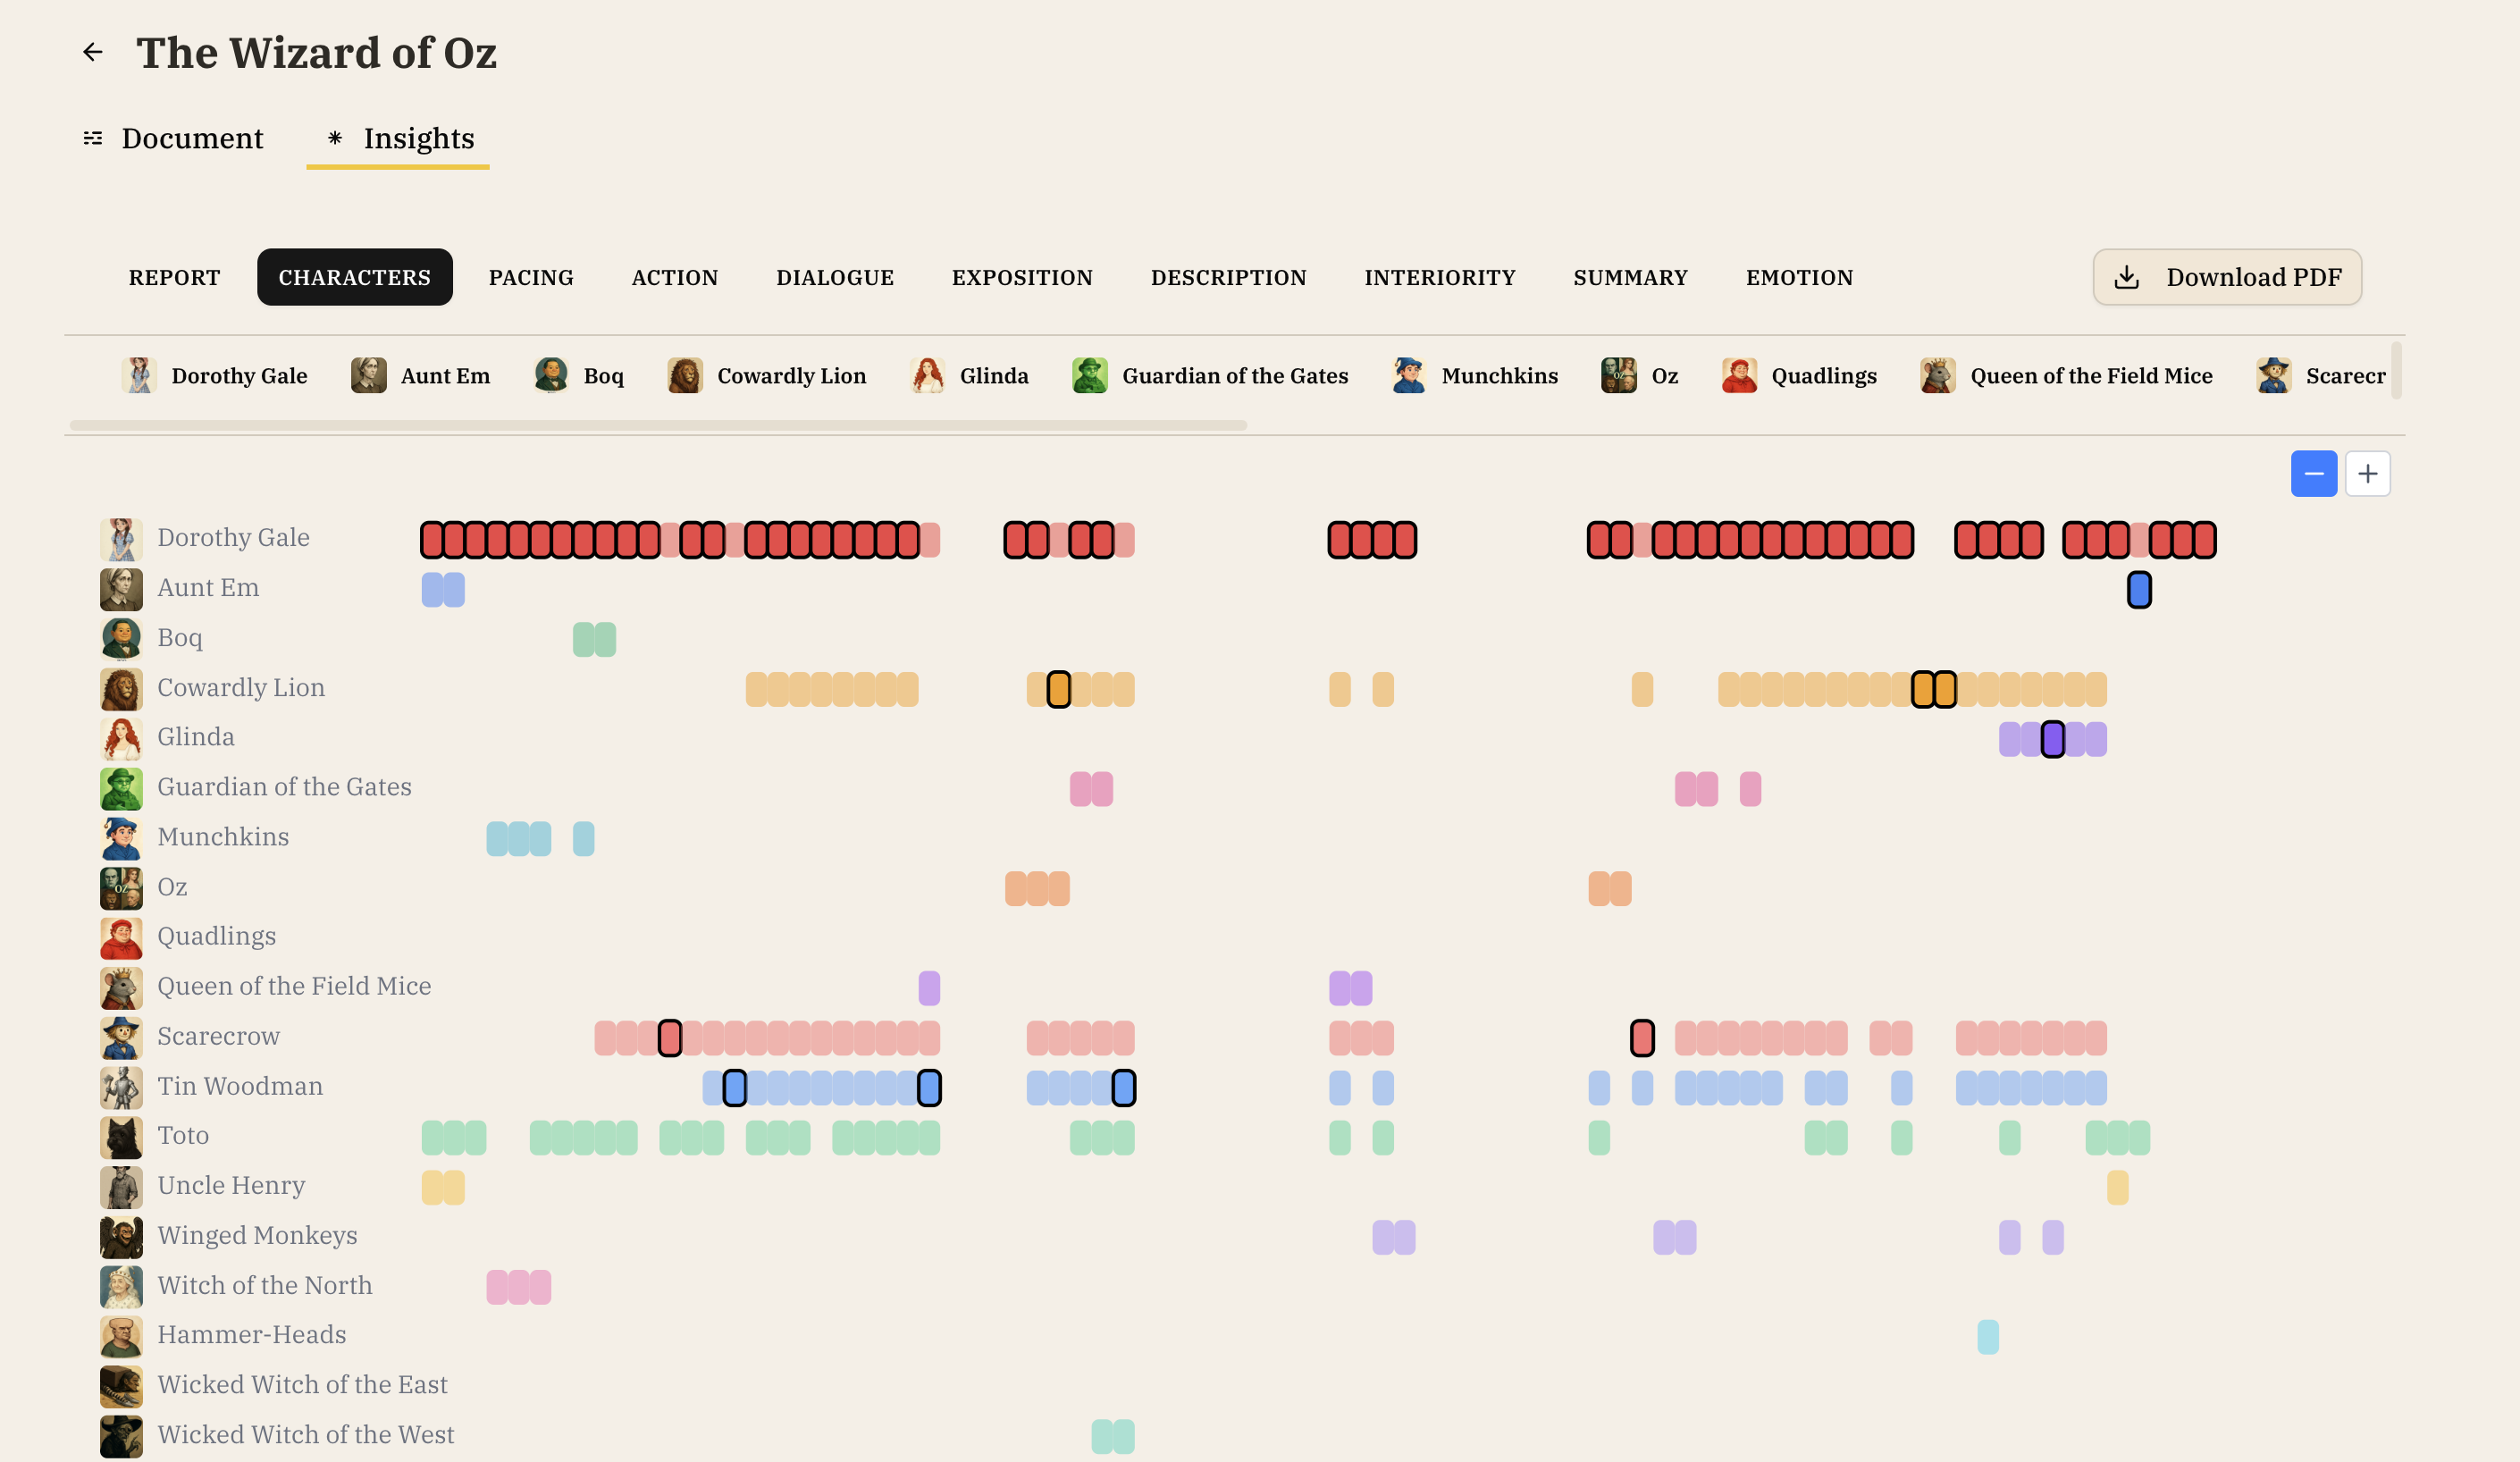
Character Heatmap
- Shows which characters appear in which chapters
- Visualizes character presence throughout the story
- Click on a character to see a detailed Wiki with statistics
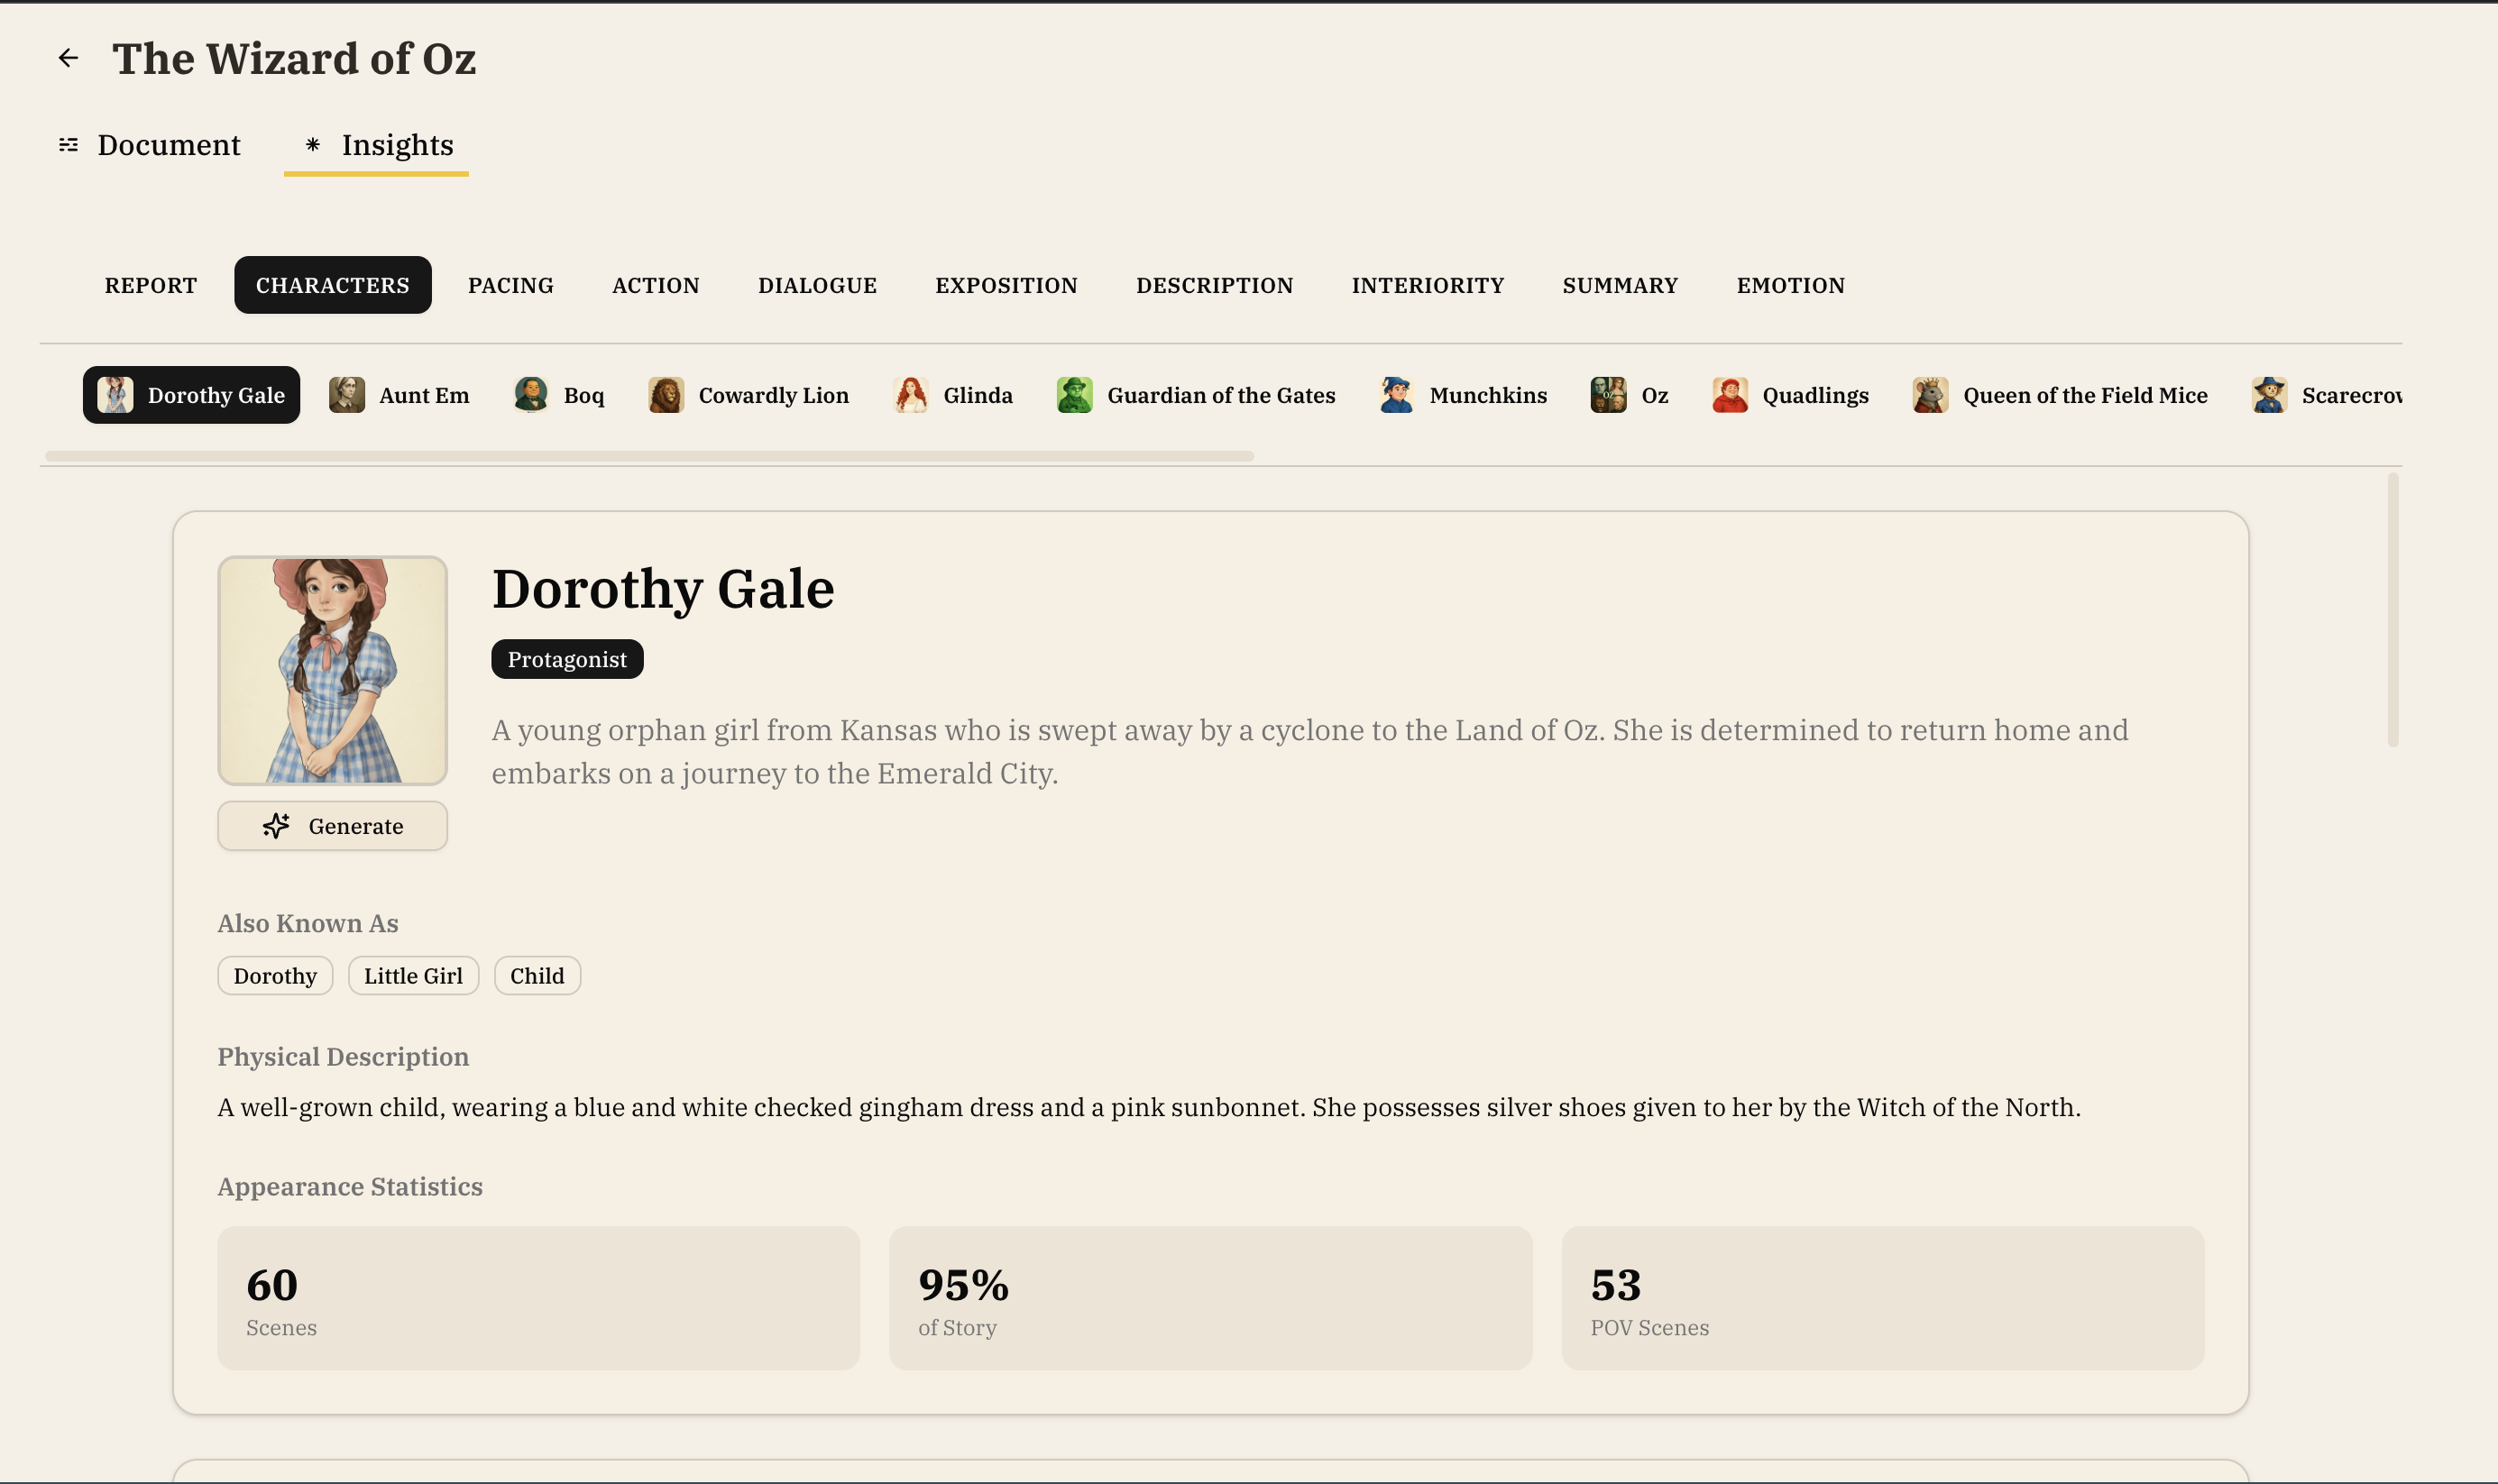
Character Details
Accessible from the Character Heatmap
Selecting a character from the Character Heatmap view will show you their:
- Appearance Statistics: Number of chapters, percentage of story, POV chapters
- Chapter-by-Chapter Presence: Interactive heatmap of their appearances
- Character Arc Analysis: How their role evolves throughout the story